Download
1 / 86
860 likes | 876 Views
Explore the concept of risk, measures and calculations, public perception, and the importance of models in risk analysis. Includes examples of historical accidents and large accidents in new technologies. Presented by Richard Wilson, Professor of Physics (emeritus) at Harvard School of Public Health.

E N D
The Development of Risk Analysis: A Personal Perspective March 19th 2012 2:30pm Harvard School of Public Health Richard Wilson Mallinkrodt Professor of Physics (emeritus)
1800s– Try out the technology, modify if any problems arise. In 1833, when the first passenger railway in the world Liverpool to Manchester opened, an engine ran down a Member of Parliament, who failed to get out of the way. Was the outcome good or bad? Depends on his Party affiliation!
What do we mean by Risk? Measures of Risk How do we Calculate Risk? • History (b) Event Tree (c) Animal Analogy (d) Other
Yet data show unequivocally that life is getting better. We all know that! So what are the public saying?
What is Life Expectancy? Both the specific death rate and the life expectancy at birth have a dip at 1919 world wide influenza epidemic. BUT anyone born in 1919 will not actually see this dip.Peculiarity of definition of life expectancy.
Uncertainties and PerceptionTypes of Uncertainties Role of Perception Kahneman’s 2002 economics Nobel prize(Tversky and Kahneman, 1981) People are inconsistent but the inconsistency has a pattern Major differences between Public and Expert perceptions
Tversky’s Analysis (72%) Assuming that the U.S. is preparing for an outbreak of a disease imported from Asia two alternative programs: Program A: 200 people would be saved. Program B: 1/3 chance that 600 will be saved and 2/3 that no one will be saved.
Tversky’s Analysis (cont.) (78%) Alternatively… Program C: 400 people will die. Program D: a 1/3 probability that no one will die and a 2/3 probability that 600 will die.
Simple arithmetic tells us that options C and D have the same effect as options A and B. When the question was posed as saving lives the students were risk averse. BUT When the question was posed as preventing deaths they favored risk! Stanford and Harvard students were the same
MEASURES of Risk • Per • year • lifetime • unit operation • event • ton • unit output Simple risk of Death (assuming no other causes)by ageby cause Risk of Injury by cause by type by severity
RISK MEASURES (continued) Loss of Life Expectancy (LOLE) Years of Life Lost (YOLL) Man Days Lost (MDL) Working Days Lost (WDL) Public Days Lost (PDL) Quality Adjusted Life Years (QALY) Disability Adjusted Life Years (DALY) Different decisions may demand different measures
LOLE from cigarette smoking In USA 600 billion cigarettes made (presumably smoked)400,000 people have premature death (lung cancer, other cancers, heart)1,500,000 cigarettes per deathEach death - 17 years (8,935,200 minutes) off life or 6 minutes per cigaretteABOUT THE TIME IT TAKES TO SMOKE ONE
What questions are you asking? IF YOU DON’T KNOW… THE CHANCE OF A SENSIBLE ANSWER IS REDUCED.
The Importance of Models Every risk calculation involves a model. The simplest is: NEXT YEAR WILL BE LIKE LAST YEAR. NEXT YEAR WILL BE LIKE LAST YEAR WITH IMPROVEMENTS. EVERY MODEL HAS ASSUMPTION WHICH MUST BE CLEARLY STATED
Wigner: “whenever there is a lot of energy in one place and a lot of people in the same place, there is a potential for disaster. 1848– no petroleum products brought up the Thames River closer than 30 miles east of London Bridge (Canvey Island) (VERY WISE) 1978– 120 seventeen million gallon tanks in Canvey (for LNG each is 20 Hiroshimas) Plus 500 vacation cottages With one access road EASY TO IMAGINE DISASTER
Even ignored historical data includes big risks 65 million years ago - large meteor impact may have destroyed the dinosaur Risk per year 1/65 million for everyone Lifetime risk 1 in a million including smaller impacts we get lifetime risk 1/100,000 Yet EPA pretended to regulate at 1 in a million!
Beware of risk assessments that make assumptions that an important parameter is precise.(US EPA)
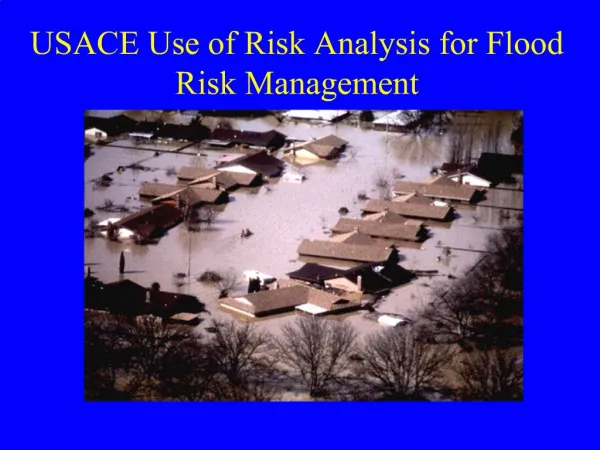
Large Accidents in New Technologies After World War II, the old paradigm was inadequate: “try it and if it gives trouble, fix it” Society now demands evidence, in advance, that the technology is safe. The first major example was nuclear energy. WHY WAS THAT THE FIRST EXAMPLE?
A number of reasons have been suggested: The new technology was in hands of fundamental scientists from start: 1946 The US Atomic Energy Commission (AEC) The new technology used new physical principles. The new technology arose simultaneously with a new deadly form of war. The new technology posed unprecedented hazards.
Atomic Energy Commission Established an Advisory Committee on Reactor Safeguards (ACRS) to advise on safety. Outstanding Scientists: Glenn Seaborg, John Von Neuman, Robert Bacher, Edward Teller, Eugene Wigner and Richard Feynman
Defense in Depth (a name borrowed from the military) Imagine the worst thing that can reasonably go wrong in the reactor, the “Maximum Credible Accident” devise an engineered safeguard to prevent it Large reactors, particularly first in a series, in unpopulated areas, following Wigner’s principle. The Reactor Safety Study (Rasmussen et al. 1975) calculated beyond the maximum credible accident
ASSUMPTIONS • We have drawn all possible trees with consequences • The probabilities are independent (design to make them so; look very carefully at correlation • Consider carefully - with some confidentiality - actions that can artificially correlate the separate probabilities
INDEPENDENCE IS CRUCIAL • DO NOT break down detail in event tree beyond what independence allows • Fukushima: Earthquake and Tsunami are NOT independent • But effect of radiation and accident calculation are independent
BUT! A TERRORIST GROUP CAN DESTROY INDEPENDENCE: INITIATE A PIPE BREAK (SMALL BOMB) AND BOMB ON CONTAINMENT AT THE SAME TIME SET OFF WHEN WIND IS BLOWING TOWARD CITY
What about chemicals Paracelsus - “The dose makes the poison” More is worse Less is better IS there a threshold?BUT beware of exceptions
Epidemiology Associate Death (or other Measure)to Postulated Cause Is it statistically significant? Are there alternative causes (confounders)? No cause is generally accepted unless there is a group where death rate has doubled.Risk Ratio (RR) > 2 But beware of stupid answers
Obviously storks bring babies. BUT direction of causality may be wrong Babies bring storks Correlation, by itself, does not imply causality Yet in March 2012 : NH legislature correlation between women’s cancer rate and prostate cancer implies causality
Issues in Low Dose Linearity Is the observed effect identical to one that occurs naturally? (pathologists should not be able to tell difference) Is DNA the same? IF so: consider natural processes at same time as pollutant Probable that somewhere in the cancer causing mechanism a pollutant acts like a natural process and a bit more cancer (linear) (radiation cancers, chemical cancers, lung from air pollution) But slope extrapolated down from high levels
Issues in Low Dose Linearity • Implicit in Armitage and Doll (1954) • Explicit in Crump et al. (1976) • extended to any outcome including air pollution • Crawford and Wilson (1996)
We contrast two types of medical response to pollutants.ACUTE TOXIC EFECTA dose within a day causes death within a few days(causality easy to establish)CHRONIC EFFECTlower doses repeated give chronic effects (cancer, heart) within a lifetime.(Causality hard to establish)
Characteristics • One dose or dose accumulated in a short time KILLS • 1/10 the dose repeated 10 times DOES NOT KILL
Early Optimism Based on Poisons There is a threshold below which nothing happens BUT J.G. Crowther 1924 Probability of Ionizing a Cell by radiation is Linear with Dose Naively this would lead to many cancers each second. There must be a repair mechanism. Is that linear?
Incremental Risk can actually be greater than the simple linearity assumption of a non-linear biological dose-response is assumed ALSOPossible to have 2 effects. One benign or beneficial, other adverse
Can animals help us?Especially laboratory animals, rats and miceRat lung and human lung are similar
These principles do not work for cancer Arguments due to Richard Peto Rat lungs look like people’s lungs If a piece of tissue is equally likely to develop a cancer whether attached to rat or man Cancer in man/cancer in rat (for same dose) =() x (mass-man/mass-rat) =millions Actually closer to one Test needed. Compare rats and mice use whatever human data we have (20 or so chemicals)
Usual model: A toxic chemical will be carcinogenic highly toxic - highly carcinogenicIf carcinogenic in animalscarcinogenic in people.What is the uncertainty in this assumption?What do data say?What does EPA say?