Unraveling Outflows in AGN: Spectral Differences in Lensed Quasar Images via LAMAS
170 likes | 297 Views
The study introduces Lens-Aided Multi-Angle Spectroscopy (LAMAS) to analyze spectral differences in lensed quasar images, specifically SDSS J1004+4112. By investigating the significance of these differences, this research aims to enhance understanding of outflows in active galactic nuclei (AGN). The findings suggest that the observed spectral variations may challenge microlensing and intrinsic variability hypotheses, indicating the presence of high-column, highly-ionized winds in quasars. This study offers new insights into the dynamics of AGN outflows and their implications for quasar spectra.

Unraveling Outflows in AGN: Spectral Differences in Lensed Quasar Images via LAMAS
E N D
Presentation Transcript
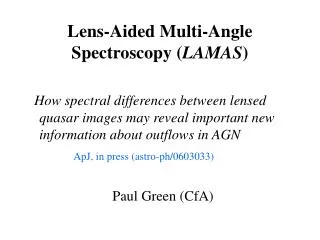
Lens-Aided Multi-Angle Spectroscopy (LAMAS) How spectral differences between lensed quasar images may reveal important new information about outflows in AGN ApJ, in press (astro-ph/0603033) Paul Green (CfA)
Zqso =1.74 zcl =0.68 Inada et al. 2003
SDSS J1004+4112 HST ACS image (Inada et al. 2005) HST ACS
Spectroscopic Differences in Lensed Quasar Images Bona fide lensed quasars show significant differences between image components in • Optical/UV spectra • HE2149--2745; SBS1520+530 (Burud et al. 2002) • SDSSJ1004+4112 (Inada et al. 2003) • SDSSJ1206+4332 (Oguri 2005) • Absorber properties in BALQSO lenses • APM0829+5255 (Lewis et al. 2002) • H1413+117 (Angonin et al. 1990)
Hypothesis 1: Microlensing • Integral field spectroscopy from [Wisotski et al. 2004] shows that A/B continuua are identical while CIV difference persist • Microlensing unlikely to amplify part of the BELR but not the continuum region • CIV blue wing enhancement disappears and reappears • Strong profile differences persist in CIII] and MgII [Richards et al. 2004], which originate from larger regions.
Hypothesis 2:Intrinsic Variability • The asymmetry (rA-rB)/(rA+rB) of the A and B images wrt the lens means the maximum delay between them is <30d [Oguri et al. 2004] • B never showed a bluewing bump, although it persisted in A for >>1 month. [Richards et al. 2004]
SDSS BAL and non-BAL QSO Composites Reichard et al. 2003
Skimming the Spinning Dented Bugle Bell? Elvis (2000)
Geometry LAMAS and variability in SDSSJ1004+4112 provide complementary constraints on absorber size From rotation speed; variability timescale (a<300AU) θFrom absorber distance; image splitting No match for ~RBELR (~100 lt-d or 1017cm), but OK within recent BALR distance estimates of 5 – 700pc (deKool et al 2001, Everett et al. 2002) 30<a<3000 AU
Variability in X-ray Absorbers Ubiquitous! Risaliti, Elvis & Nicastro (2002) Fast! Elvis et al. 2004 (NGC 4388)
Ubiquitous Warm Broad Absorbers? Sobolewska & Done 2005
LAMAS • The A image of SDSS J1004+4112 shows variable spectral differences not easily explained by microlensing or variability+time delay. • SDSS J1004 and other lenses may illustrate that small angle changes to the nuclear region can strongly affect spectral details. • The spectral differences mimic differential absorption from a high column, highly ionized wind.
Further Implications • Quasars have high column, highly ionized winds. • All quasar spectra may be self-absorbed by their smoothly outflowing winds. • In a large sample of lenses, spectral difference should correlate with θ and be independent of proximity to a bright galaxy of high microlensing optical depth. • X-ray measurements during a similar UV blue emission line asymmetry event should show lower absorption in that component.