
Uploaded by
navid
1 SLIDES
144 VIEWS
10LIKES
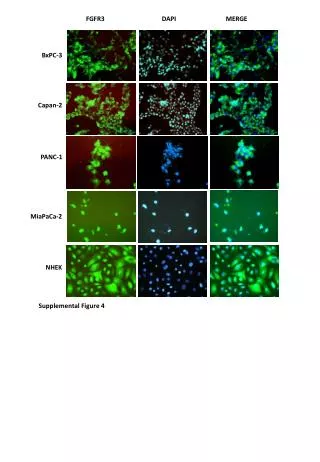
FGFR3 Expression Analysis in Various Pancreatic Cell Lines and NHEK
DESCRIPTION
Supplemental Figure 4 presents a detailed analysis of FGFR3 expression in pancreatic cancer cell lines (BxPC-3, Capan-2, PANC-1, and MiaPaCa-2) compared to normal human epidermal keratinocytes (NHEK) using DAPI staining. The merge images highlight the localization and intensity of FGFR3, providing insight into the role of this receptor in tumor biology. This figure supports our investigation into the potential therapeutic target FGFR3 in pancreatic cancer.
Download
1 / 1
Download Presentation 
FGFR3 Expression Analysis in Various Pancreatic Cell Lines and NHEK
An Image/Link below is provided (as is) to download presentation
Download Policy: Content on the Website is provided to you AS IS for your information and personal use and may not be sold / licensed / shared on other websites without getting consent from its author.
Content is provided to you AS IS for your information and personal use only.
Download presentation by click this link.
While downloading, if for some reason you are not able to download a presentation, the publisher may have deleted the file from their server.
During download, if you can't get a presentation, the file might be deleted by the publisher.
E N D


More Related