Download
1 / 11
110 likes | 193 Views
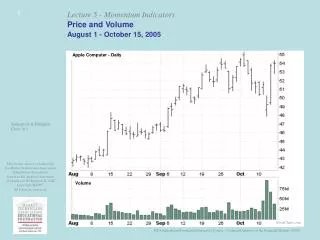
Explore the price and volume trends of Apple Computer stock from August to October 2005 through various technical analysis tools like MACD, RSI, and Stochastic indicators. Analyze patterns like Rising Wedge, Triangle, and more.

E N D
Price and Volume August 1 - October 15, 2005 Apple Computer - Daily Kirkpatrick & Dahlquist Chart 18.1 Volume StockCharts.com
On-Balance Volume July 22 - October 15, 2005 Apple Computer - Daily Kirkpatrick & Dahlquist Chart 18.3 On-Balance Volume (OBV) StockCharts.com
Chaiken Accumulation Distribution July 22 - October 15, 2005 Apple Computer - Daily Kirkpatrick & Dahlquist Chart 18.5 Accumulation Distribution (AD) Chaiken Formula StockCharts.com
Volume Oscillator July 22 - October 15, 2005 Apple Computer - Daily Kirkpatrick & Dahlquist Chart 18.6 Volume with Trend Volume against Trend Volume Oscillator StockCharts.com
Chaiken Money Flow July 22 - October 15, 2005 Apple Computer - Daily Kirkpatrick & Dahlquist Chart 18.7 Chaikin Money Flow StockCharts.com
Volume Spikes July 18 - October 17, 2005 Apple Computer - Daily Rising Wedge Kirkpatrick & Dahlquist Chart 18.10 Descending Triangle Rectangle StockCharts.com
Moving Average Convergence-Divergence (MACD) July 18 - October 17, 2005 Apple Computer - Daily Kirkpatrick & Dahlquist Chart 18.12 MACD Signal Line Overbought Line MACD StockCharts.com
Rate of Change (ROC) July 18 - October 17, 2005 Apple Computer - Daily Kirkpatrick & Dahlquist Chart 18.13 14-Day Rate of Change (ROC) StockCharts.com
Relative Strength Index (RSI) July 19 - October 15, 2005 Apple Computer - Daily Kirkpatrick & Dahlquist Chart 18.14 14-Day Relative Strength Index (RSI) Swing Failure Breakout Triangle StockCharts.com
Stochastic July 19 - October 15, 2005 Apple Computer - Daily Kirkpatrick & Dahlquist Chart 18.15 Overbought Down-ward Crossover Swing Failure and Breakdown Swing Failure and Breakup 14-3-3 Slow Stochastic Oversold Upward Crossover StockCharts.com
MACD and RSI July 19 - October 15, 2005 Apple Computer - Daily Kirkpatrick & Dahlquist Chart 18.17 14-Day Relative Strength Index 3/10 MACD StockCharts.com