Download
1 / 27
270 likes | 430 Views
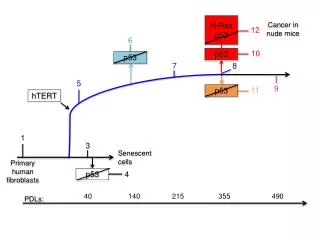
p53 Mutant Mice with Altered Cancer and Aging Phenotypes. Larry Donehower Baylor College of Medicine Houston, Texas 77030. p53 - A Major Node in the Cellular Stress Response. ROS. Hypoxia. IR,UV. Oncogenes. Telomere loss. p53. mdm2. SirT1. Cell Cycle Arrest. Apoptosis. p66Shc. ?.

E N D
p53 Mutant Mice with Altered Cancer and Aging Phenotypes Larry Donehower Baylor College of Medicine Houston, Texas 77030
p53 - A Major Node in the Cellular Stress Response ROS Hypoxia IR,UV Oncogenes Telomere loss p53 mdm2 SirT1 Cell Cycle Arrest Apoptosis p66Shc ? ? Transient Terminal ? Senescence Organismal Aging??
100 80 60 40 20 0 p53+/+ n = 56 p53+/- n = 217 % SURVIVORS p53-/- n = 72 1.0 1.5 2.0 2.5 3.0 0 0.5 AGE (YEARS)
ABERRANT GENE TARGETING INTRODUCES A p53 DELETION Wild Type p53 Allele * 11 1 4 5 8 7 Aberrant Gene Targeting deletion 1-6 * Pr “m” p53 Allele 11 8 7 AAA “m” mRNA AUG Truncated C-terminal p53 fragment p53 a.a. 240-390 “m” protein Missing: Transactivation domain DNA binding domain
m protein Interacts with Wt p53 in vitro In vitro translation of m allele message. IP with p53 Ab PAb421 m protein present in tissues p53+/m mice GST GST-p53 C WT m + m + m + m + m - m 53 kd 24 kD 24 kD Spleen Kidney Heart Liver Saos2 24 kD 7 kD M allele mRNA is translated into a C-terminal truncated p53 protein in vitro and in vivo
Possible Effects of m Protein on Tumorigenesis No Effect (Null Allele) p53+/m --> tumors same as p53+/- m Oncogenic Effect p53+/m --> tumors before p53+/- Tumor Suppressor Effect p53+/m --> tumors later than p53+/-
p53 +/m mice have reduced longevity +/m medium lifespan = 96 weeks +/+ median lifespan = 118 weeks
p53 +/m mouse phenotype • • Tumor resistance • • Reduced longevity • • Reduced body weight • Osteoporosis • Lordokyphosis • Organ atrophy • Decreased regeneration & stress tolerance p53 +/+ Mice appear normal until 12 months, overt phenotype by 16-18 months. p53 +/m
Spleen Liver Kidney Age-associated organ atrophy in p53 +/m mice and humans Humans p53 +/+ Mice p53 +/m Body
Osteoporosis in the p53 +/m mouse p53 +/+ p53 +/m
Skin Atrophy in p53+/m Mice p53+/+ 3 mo p53+/m 3 mo p53+/+ 24 mo p53+/m 24 mo
Muscle atrophy in 24 month p53+/m mice 150 100 Muscle Mass (mg) 50 0 p53+/+ p53+/m
+/m +/+ 3M mice 24M mice p53 +/m mouse exhibits a decreased regenerative response Wound healing: • Re-epithelization of skin following 3mm biopsy punch. • 24 month p53 +/m mice show reduced ability to close wound.
Aging Phenotypes of p53 +/m Mice Phenotype p53+/+ p53+/m Median Life Span 118 weeks 96 weeks Maximum Life Span 164 weeks 136 weeks Cancer Incidence >45% <6% Body Weight Reduced by 30m Reduced by 18m Organ Weights (24m)Minimal loss25-40% loss Lymphoid AtrophyModeratePronounced LordokyphosisModestPronounced OsteoporosisMinimalPronounced Blood Chemistry Normal Normal Peripheral WBC, RBC Counts Normal Normal Male Fecundity Normal Normal Hair Graying and Alopecia Minimal Minimal Hair RegrowthModestly ReducedGreatly Reduced Dermal ThicknessModerately ReducedGreatly Reduced Subcutaneous AdiposeModerately ReducedGreatly Reduced Wound HealingNormal Re-epithelializationReduced Re-ep. Muscle AtrophyModeratePronounced Tolerance Anesthetic Stress Good Poor 5-FU Myeloablation Robust WBC Reduced WBC
21 month +/m Liver Senescence-associated beta galactosidase assay Assay, developed by Campisi and colleagues, is specific for senescent cells. Quiescent, presenescent, or immortal cells not stained. Senescent cells stain blue when incubated at pH 6.0 with X-gal. 3. Recently, we have tested this assay in fixed tissues in situ (below is a 20 month p53+/m liver section with blue stained senescent cells).
21 month 3 month 3 month 21 month Old p53+/m mice show higher percentages of senescent liver cells
Old p53+/m mice show higher percentages of senescent spleen cells 3 month 21 month 3 month 21 month
TA TA TA TA DNA Bind DNA Bind DNA Bind DNA Bind m C-Term Ac P P C-Term Activated WT p53 Latent WT p53 Proposed model of m function C-Term DNA Damage Oncogenes Ac P P C-Term Removal of stressors Latent WT p53 Activated WT p53 Cell cycle arrest Apoptosis Senescence
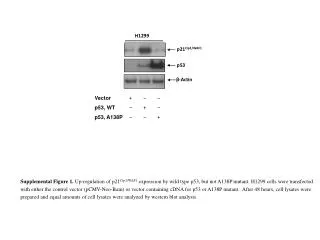
Elevated p53 levels and stability in the presence of the m protein • Before and after 5G g-IR
Mice with Increased p53 Activity Our Lab p53+/m Cancer Resistance Early Aging Phenotypes Mut p53 WT p53 WT p53 TG Serrano Super p53 Cancer Resistance Normal Aging WT p53 WT p53 Mut p53 TG Scrable Truncated p53 Transgenic Runted Mice Early Aging Phenotypes WT p53 WT p53
Tissue stem cells and aging • Adult tissue stem cells are critical for maintaining organ cellularity and function (homeostasis). • Multiple adult stem cells have been shown to exhibit age- related decline in functionality. • Relative reduction of HSC functionality may vary with mouse strain longevity (Van Zant). • p53+/m mice exhibit early organ atrophies and reduced regenerative responses, suggesting earlier failures in maintaining organ homeostasis. • These p53+/m phenotypes suggest an earlier age-associated reduction in stem cell functionality.
Young HSC numbers • p53 +/m mice appear to have reduced numbers of progenitor HSC compared to p53 +/+, +/- and -/- mice. • No significant difference between the p53 +/+, +/- and -/- mice.
Young HSC proliferation • p53 -/- and +/- HSC proliferative index approximately two fold more than +/+ and +/m counterparts. • These results comparable to the MSC proliferation profile.
Analysis of SP-HSC in p53 +/+ and +/m mice p53 +/+ p53 +/m Sca-1+= 36.62% Sca-1+= 18.97% SP cells are selected from total bone marrow by Hoechst/PI sorting. Pure SP cells are identified by selection of Sca-1+ and GR-1- cells.
Reduced Numbers of p53+/m Sca-1+ SP Stem Cells in Marrow 18 month old mice
DOES p53 DOSAGE AFFECT STEM CELL FUNCTION? TUMOR p53+/- Stem Cell Functional Capacity Homeostasis Reduced Cellularity Reduced Function Reduced Stress Tolerance p53+/+ p53+/m Death
Donehower Lab Stuart Tyner Jene Choi Nader Ghebranious Sundaresan Venkatachalam Xiongbin Lu Herbert Igelmann Melissa Dumble Bradley Lab Allan Bradley Steve Jones Baylor Cory Brayton Gerard Karsenty Dennis Roop Peggy Goodell Monica Justice Andy Salinger Kentucky Gary Van Zant National Cancer Institute National Institute on Aging Acknowledgements