Download
1 / 29
290 likes | 450 Views
Vegetation Water Status from Optical Remote Sensing ___ Preliminary results from the NAFE05 experiment. Philippe Maisongrande, Julian Kuhlmann Gilles Boulet, Bertrand Guerrero. RED. NIR. SWIR. NDVI=( r nir- r red) ( r nir+ r red). SWVI=( r nir- r swir)

E N D
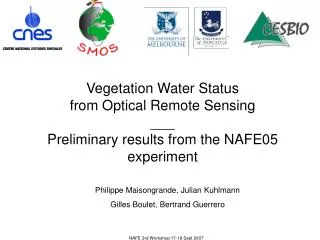
Vegetation Water Status from Optical Remote Sensing___Preliminary results from the NAFE05 experiment Philippe Maisongrande, Julian Kuhlmann Gilles Boulet, Bertrand Guerrero NAFE 3rd Workshop 17-18 Sept 2007
RED NIR SWIR NDVI=(rnir-rred) (rnir+rred) SWVI=(rnir-rswir) (rnir+rswir) Optical Remote Sensing and VWC -Rational (1)- NAFE 3rd Workshop 17-18 Sept 2007
RED NIR SWIR NDVI=(rnir-rred) (rnir+rred) SWVI=(rnir-rswir) (rnir+rswir) Optical Remote Sensing and VWC -Rational (1)- unstressed stressed NAFE 3rd Workshop 17-18 Sept 2007
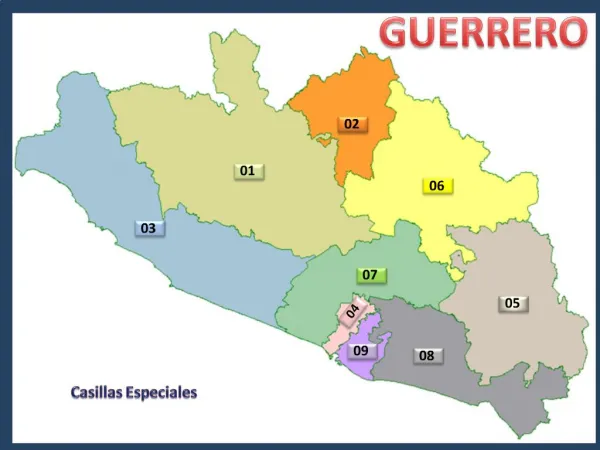
1998->2006 average NDVI -Spot/VEGETATION data- Precipitation climatology -Australian Bureau of Meteo.- NAFE 3rd Workshop 17-18 Sept 2007
VEGETATION onboard SPOT 4&5 MODIS differences (aqua&terra) 1.3 and 2.3 µm 250m (Red&NIR) 500m otherwise No 1.6 µm (aqua) • Operational Mission (available free data on the web) • 4 channels: Blue (0.43 - 0.47 µm) • Red (0.61 - 0.68 µm) • Near InfraRed (NIR) (0.78 - 0.89 µm) • Shortwave InfraRed (1.58 - 1.75 µm) • Dayly global coverage (at km2 res.) • & 10day synthesis corrected for atmospheric effects • 9 yearsof consistent archive (1998-2006) • A third mission under study NAFE 3rd Workshop 17-18 Sept 2007
El Niño & La Niña Events Maisongrande, Kuhlmann et al. MODSIM 2007 NAFE 3rd Workshop 17-18 Sept 2007
NDVI & SWVI vs Southern Oscillation Index Maisongrande, Kuhlmann et al. MODSIM 2007 NDVI SWVI NAFE 3rd Workshop 17-18 Sept 2007
RATIONAL (2) VWC ~ 1-(EC’/A’C’) -> A*NDVI-B*SWVI+C > NDVI-SWVI (D) NAFE 3rd Workshop 17-18 Sept 2007
(NDVI-SWVI) vs Southern Oscillation Index Maisongrande, Kuhlmann et al. MODSIM 2007 1.5*D-0.75 0.15+SOI/100 NAFE 3rd Workshop 17-18 Sept 2007
FOCUS on NAFE2005 • Database handling and organization (multi-layer consistency) • Preparation of the Land Use Land Cover map (LULC) • Preliminary analysis • -Satellite indices against in situ measurements of Vegetation Water Content (VWC) NAFE 3rd Workshop 17-18 Sept 2007
exhaustive sparse DATABASE organization and handling Insitu Ancilary Satellite (or infered from it) NAFE 3rd Workshop 17-18 Sept 2007
NDVI & SWVI vs Southern Oscillation Index Maisongrande, Kuhlmann et al. MODSIM 2007 NAFE 3rd Workshop 17-18 Sept 2007
Open woodland Bare soil forest crop Native grass NAFE 3rd Workshop 17-18 Sept 2007
Open woodland Bare soil forest crop Native grass NDVI SOI NAFE 3rd Workshop 17-18 Sept 2007
NDVI_VGT vs VWC NAFE 3rd Workshop 17-18 Sept 2007
SWVI_VGT vs VWC NAFE 3rd Workshop 17-18 Sept 2007
D_VGT vs VWC NAFE 3rd Workshop 17-18 Sept 2007
Regression between VGT VIs and VWC for various classes r2 2 1 3 11 37 36 5 15 6 4 NAFE 3rd Workshop 17-18 Sept 2007
SWVI SPOT/VGT2 10day composite images SPOTVGT2 Dates composite MODIS Available and clear dates dates 01/11 03/11 7/ 11 9 /11 12 of November 17 of November 21 of November S30 SPOT/ VEGETATION 10day composite products = Each S10 image is a patchwork of dates S31 S32 Imgclass.m NAFE 3rd Workshop 17-18 Sept 2007
R2 sensitivity to the time lag between field VWC and satellite measurements NAFE 3rd Workshop 17-18 Sept 2007
NDVI 12/11 MODIS vs VGT NAFE 3rd Workshop 17-18 Sept 2007
NDVI_MODIS vs VWC NAFE 3rd Workshop 17-18 Sept 2007
NDVI_VGT vs VWC NAFE 3rd Workshop 17-18 Sept 2007
Regression between MODIS VIs and VWC for various classes r2 2 1 3 13 38 40 6 16 6 6 NAFE 3rd Workshop 17-18 Sept 2007
Regression between VGT VIs and VWC for various classes r2 2 1 3 11 37 36 5 15 6 4 NAFE 3rd Workshop 17-18 Sept 2007
R2 sensitivity to the time lag between field VWC and MODIS measurements NAFE 3rd Workshop 17-18 Sept 2007
CONCLUSIONS Investigation on the potential of optical sat. data to assess the plant water status: Disappointing with SPOT/VGT (1km2=pixel heterogeneity) Encouraging with MODIS (250m) Relative good score for SWVI (2.1mm) compared to NDVI and D. (no way to evaluate 1.6mm @250m resolution) Strong effort on the organization collect of VGT images, consistency Classification labeled thanks to in situ inquiries, but the labeling has to be considered with care. Toward modeling studies involving prepared layers, (optical and thermal data). SMOS L2 ->L4 ; NAFE06 NAFE 3rd Workshop 17-18 Sept 2007