Download
1 / 1
20 likes | 193 Views
Seasonal distribution of ozone in the upper troposphere Level 2 : [15-45] mb below the tropopause (seen as PV=2 pvu.). Seasonal distribution of ozone in the lower stratosphere Level 4 : [15-45] mb above the tropopause (seen as PV=2 pvu.). WINTER. SPRING. GREENLAND. -200 mb. Spring.

E N D
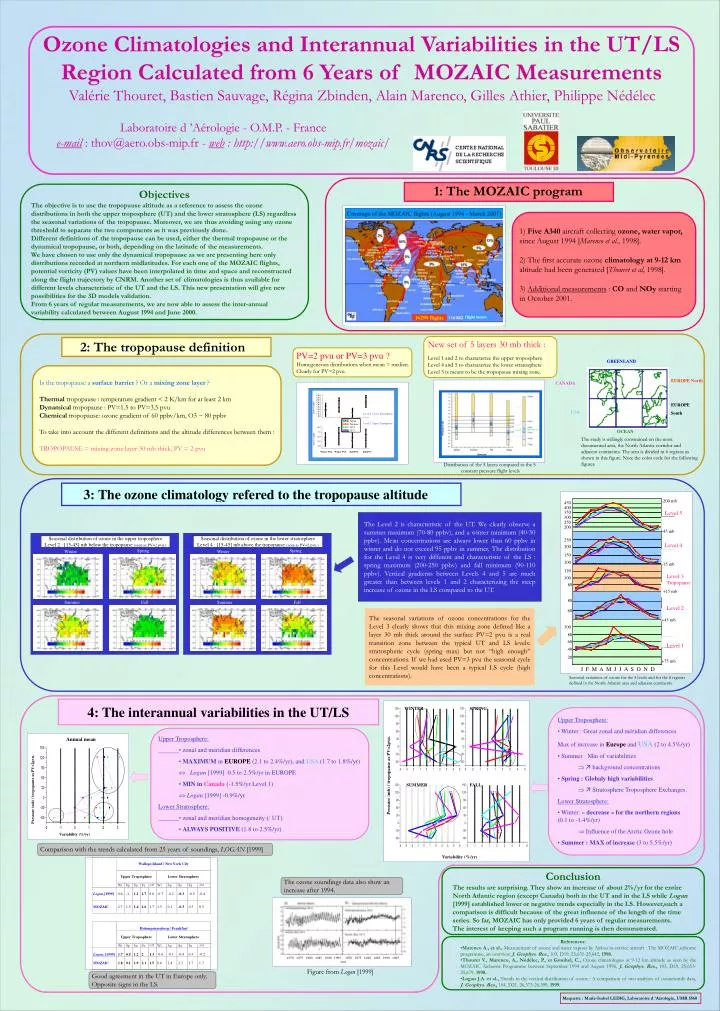
Seasonal distribution of ozone in the upper troposphere Level 2 : [15-45] mb below the tropopause (seen as PV=2 pvu.) Seasonal distribution of ozone in the lower stratosphere Level 4 : [15-45] mb above the tropopause (seen as PV=2 pvu.) WINTER SPRING GREENLAND -200 mb Spring Spring Winter Winter 450 EUROPE North CANADA Ozone Climatologies and Interannual Variabilities in the UT/LS Region Calculated from 6 Years of MOZAIC Measurements 400 350 300 EUROPE South 250 USA -45 mb 200 Annual mean OCEAN 250 Pressure (mb) / tropopause as PV=2pvu. 200 SUMMER FALL 150 Summer Summer Fall Fall -15 mb Valérie Thouret, Bastien Sauvage, Régina Zbinden, Alain Marenco, Gilles Athier, Philippe Nédélec 100 120 Pressure (mb) / tropopause as PV=2pvu. 100 +15 mb 80 Laboratoire d ’Aérologie - O.M.P. - France e-mail : thov@aero.obs-mip.fr - web : http://www.aero.obs-mip.fr/mozaic/ 80 Variability (%/yr) 60 +45 mb Variability (%/yr) 100 80 60 40 1: The MOZAIC program Objectives The objective is to use the tropopause altitude as a reference to assess the ozone distributions in both the upper troposphere (UT) and the lower stratosphere (LS) regardless the seasonal variations of the tropopause. Moreover, we are thus avoiding using any ozone threshold to separate the two components as it was previously done. Different definitions of the tropopause can be used, either the thermal tropopause or the dynamical tropopause, or both, depending on the latitude of the measurements. We have chosen to use only the dynamical tropopause as we are presenting here only distributions recorded at northern midlatitudes. For each one of the MOZAIC flights, potential vorticity (PV) values have been interpolated in time and space and reconstructed along the flight trajectory by CNRM. Another set of climatologies is thus available for different levels characteristic of the UT and the LS. This new presentation will give new possibilities for the 3D models validation. From 6 years of regular measurements, we are now able to assess the inter-annual variability calculated between August 1994 and June 2000. +75 mb 20 D J F M A M J J A S O N D J F M A M J J A S O N 1) Five A340 aircraft collecting ozone, water vapor, since August 1994 [Marenco et al., 1998]. 2) The first accurate ozone climatology at 9-12 km altitude had been generated [Thouret et al, 1998]. 3) Additional measurements : CO and NOy starting in October 2001. New set of 5 layers 30 mb thick : Level 1 and 2 to characterize the upper troposphere Level 4 and 5 to characterize the lower stratosphere Level 3 is meant to be the tropopause mixing zone. 2: The tropopause definition PV=2 pvu or PV=3 pvu ? Homegeneous distributions when mean = median. Clearly for PV=2 pvu. Is the tropopause a surface barrier ? Or a mixing zone layer ? Thermal tropopause : temperature gradient < 2 K/km for at least 2 km Dynamical tropopause : PV=1.5 to PV=3.5 pvu Chemical tropopause: ozone gradient of 60 ppbv/km, O3 ~ 80 ppbv To take into account the different definitions and the altitude differences between them : TROPOPAUSE = mixing zone layer 30 mb thick,PV = 2 pvu The study is willingly constrained on the most documented aera, the North Atlantic corridor and adjacent continents. The area is divided in 6 regions as shown in this figure. Note the color code for the following figures. Distribution of the 5 layers compared to the 5 constant pressure flight levels Level 5 The Level 2 is characteristic of the UT. We clearly observe a summer maximum (70-80 ppbv), and a winter minimum (40-50 ppbv). Mean concentrations are always lower than 60 ppbv in winter and do not exceed 95 ppbv in summer. The distribution for the Level 4 is very different and characteristic of the LS : spring maximum (200-250 ppbv) and fall minimum (90-110 ppbv). Vertical gradients between Levels 4 and 5 are much greater than between levels 1 and 2 characterizing the steep increase of ozone in the LS compared to the UT. 3: The ozone climatology refered to the tropopause altitude Level 4 Level 3 Tropopause Level 2 The seasonal variations of ozone concentrations for the Level 3 clearly shows that this mixing zone defined like a layer 30 mb thick around the surface PV=2 pvu is a real transition zone between the typical UT and LS levels: stratospheric cycle (spring max) but not “high enough” concentrations. If we had used PV=3 pvu the seasonal cycle for this Level would have been a typical LS cycle (high concentrations). Level 1 J F M A M J J A S O N D Seasonal variations of ozone for the 5 levels and for the 6 regions defined in the North Atlantic area and adjacent continents. 4: The interannual variabilities in the UT/LS Upper Troposphere: • Winter : Great zonal and méridian differences Max of increase inEuropeandUSA (2 to 4.5%/yr) • Summer : Min of variabilities background concentrations • Spring : Globaly high variabilities Stratosphere Troposphere Exchanges. Lower Stratosphere: • Winter: « decrease » for the northern regions (0.1 to -1.4%/yr) Influence of the Arctic Ozone hole • Summer : MAX of increase (3 to 5.5%/yr) Upper Troposphere: • zonal and meridian differences • MAXIMUM in EUROPE (2.1 to 2.4%/yr), and USA(1.7 to 1.8%/yr) Logan [1999] 0.5 to 2.5%/yr in EUROPE • MIN in Canada (-1.5%/yr Level 1) Logan [1999] -0.9%/yr Lower Stratosphere: • zonal and meridian homogeneity (/ UT) • ALWAYS POSITIVE (1.8 to 2.5%/yr) Comparison with the trends calculated from 25 years of soundings, LOGAN [1999] Conclusion The results are surprising. They show an increase of about 2%/yr for the entire North Atlantic region (except Canada) both in the UT and in the LS while Logan [1999] established lower or negative trends especially in the LS. However,such a comparison is difficult because of the great influence of the length of the time series. So far, MOZAIC has only provided 6 years of regular measurements. The interest of keeping such a program running is then demonstrated. The ozone soundings data also show an increase after 1994. • References: • Marenco A., et al., Measurement of ozone and water vapour by Airbus in-service aircraft : The MOZAIC airborne programme, an overview, J. Geophys. Res., 103, D19, 25,631-25,642, 1998. • Thouret V., Marenco, A., Nédélec, P., et Grouhel, C., Ozone climatologies at 9-12 km altitude as seen by the MOZAIC Airborne Programme between September 1994 and August 1996, J. Geophys. Res., 103, D19, 25,653-25,679, 1998. • Logan J.A. et al., Trends in the vertical distribution of ozone : A comparison of two analyses of ozonesonde data, J. Geophys. Res., 104, D21, 26,373-26,399, 1999. 1970 1975 1980 1985 1990 1995 1970 1975 1980 1985 1990 1995 year Figure from Logan [1999] Good agreement in the UT in Europe only. Opposite signs in the LS. Maquette : Marie-Isabel LEDIG, Laboratoire d ’Aérologie, UMR 5560