Download
1 / 23
230 likes | 346 Views
“Biosphere Experiment” Intercomparison of atmospheric CO 2 simulations based on biosphere fluxes from different terrestrial ecosystem models. U. Karstens, P. Peylin and CarboEurope terrestrial biosphere modellers and CarboEurope atmospheric transport modellers.

E N D
“Biosphere Experiment”Intercomparison of atmospheric CO2 simulations based on biosphere fluxes from different terrestrial ecosystem models U. Karstens, P. Peylin and CarboEurope terrestrial biosphere modellers and CarboEurope atmospheric transport modellers
“Question”Can we validate / falsify the differentterrestrial models with existing continuous European measurements ?
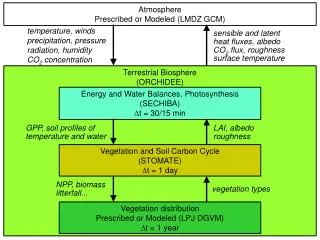
Biosphere experiment Strategy: • Forward model simulations of atmospheric CO2 using biosphere fluxes from the model intercomparison in CarboEurope-IP Integration • Differences in fluxes —> differences in CO2 concentration • Comparison with observations of atmospheric CO2 as additional evaluation of simulated fluxes Problems: • Biosphere fluxes are only available for Europe —> complete with ‘standard‘ global biosphere fluxes • Sub-daily temporal resolution is needed —> reconstruct diurnal cycle based on REMO hourly radiation
Terrestrial Ecosystem Models daily GPP and respiration or hourly NEE available:
Forward transport model simulations • Global transport models: LMDZ, TM5, TM3 • Regional transport models: REMO, DEHM • Lagrangian transport model: COMET • 2002–2005 • CO2 surface fluxes: • Biospheric fluxes from CE model intercomparison (Europe) GPP and respiration -> 3-hourly fluxes • ‘Standard‘ biospheric fluxes (global) BIOME-BGC, ORCHIDEE • Fossil fuel emissions (global) TransCom 2002-2003 • Sea-air exchange (global) TransCom 2002-2003
Transport model + different TEMs Hegyhatsal 115m
Transport model + different TEMs Hegyhatsal 115m
HUN (115 m) 2002 2003 Mean across tracers (3 models) TM5LMDZREMO 2002 2003 Mean across models(5 tracers)
HUN (115 m) 2002 2003 Mean across tracers (3 models) TM5LMDZREMO 2002 2003 Mean across models(5*2 tracers)
HUN (115 m) 2002 2003 Mean across tracers (3 models) TM5LMDZREMO 2002 2003 Mean across models(10 tracers)
Standard deviation [ppm] Station Transport Tracer MHD 0.73 0.25 PAL 0.61 0.28 BSC 0.99 0.50 CMN 1.00 0.24 SCH 1.12 0.33 HUN115 1.42 0.60 SAC 2.22 1.15 CBW200 2.30 0.79 Station Transport Tracer MHD - - PAL 2.03 2.71 BSC - - CMN 0.89 1.03 SCH 1.67 1.81 HUN115 1.69 3.17 SAC - - CBW200 - - Transport differences Tracer differences Transport differences Tracer differences ≈ 2 - 4 ≈ 0.6 - 1 Fossil fuel experiment Biosphere experiment
BIOME-BGC JULES ANN PIXGRO ppm -27 -24 -21 -18 -15 -12 -9 -6 -3 0 3 6 9 REMO+TEM-simulated CO2 July 2003 daytime sampled CO2(bio) at 300 m
ORCHIDEE ppm -27 -24 -21 -18 -15 -12 -9 -6 -3 0 3 6 9 REMO+TEM-simulated CO2 July 2003 different fluxes outside Europe ORCHIDEE global BIOME-BGC global ORCHIDEE daytime sampled CO2(bio) at 300 m
Comparison at mountain/tower sites REMO+TEM-simulated CO2 daytime sampled daily mean CO2 (bio+fos +oce)
Comparison at mountain/tower sites seasonal variations filtered daytime sampled daily mean CO2 (bio+fos +oce)
Comparison at mountain/tower sites internal vs. external sources filtered daytime sampled daily mean CO2 (bio+fos +oce)
Comparison at mountain/tower sites seasonal variation relative to Mace Head filtered daytime sampled daily mean CO2 (bio+fos +oce)
Comparison in lower troposphere REMO+TEM-simulated CO2 at 1000 m at 3000 m daytime sampled daily mean CO2 (bio+fos +oce)
Comparison in lower troposphere seasonal variations at 1000 m at 3000 m filtered daytime sampled daily mean CO2 (bio+fos +oce)
Comparison in lower troposphere seasonal variations at 1000 m at 3000 m filtered daytime sampled daily mean CO2 (bio+fos +oce)
Discussion What can we learn ? • Significant differences in some regions ! • Differences due to transport smaller than due to fluxes ! • Evaluation of regional TEM fluxes through a comparison of simulated and observed atmospheric CO2 ? • Contribution from fluxes inside Europe vs. outside Europe ? Next steps: • Evaluate simulations for time period 2002-2005 • More models ? ! • Feedback to biosphere modellers
Biosphere modellers: Galina Churkina Ralf Geyer Chris Jones Dario Papale John Tenhunen Kristina Trusilova Mona Vetter Nicolas Viovy Transport modellers: Bakr Badawy Camilla Geels Maarten Krol Christian Rödenbeck Alex Vermeulen CarboEurope Experimentalists for providing observation data Thanks for contributing to the biosphere experiment: