Download
1 / 80
800 likes | 942 Views
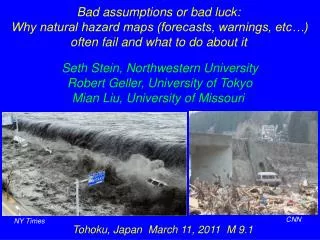
Bad assumptions or bad luck: Why natural hazard maps (forecasts, warnings, etc…) often fail and what to do about it. Seth Stein, Northwestern University Robert Geller, University of Tokyo Mian Liu, University of Missouri . CNN. NY Times. Tohoku, Japan March 11, 2011 M 9.1. Challenges

E N D
Bad assumptions or bad luck: Why natural hazard maps (forecasts, warnings, etc…) often fail and what to do about it Seth Stein, Northwestern University Robert Geller, University of Tokyo Mian Liu, University of Missouri CNN NY Times Tohoku, Japan March 11, 2011 M 9.1
Challenges Mitigation is insurance against possible disaster, with present costs & potential benefits Use science, engineering & social science to help society develop strategies that make sense relative to alternative uses of resources (steel in schools versus hiring teachers) Process hampered by limited scientific knowledge about fundamental processes & thus future events (L’aquila earthquake) The earth is very complicated and regularly reminds us of the need for humility in the face of the complexities of nature “Whenever I hear ‘everybody knows that’ I wonder how do they know that, and is it true” (D. Jackson)
"NASA owes it to the citizens from whom it asks support to be frank, honest, and informative, so these citizens can make the wisest decisions for the use of their limited resources.” Richard Feynman's (1988) report after the loss of the space shuttle Challenger
Tools in preparing for natural disasters include - Long term forecasts: 1-2500 yr (earthquakes), 100 yr (climate change), 1-10 yr (hurricane, volcano) - Short term predictions: days (hurricanes), days to months (volcano), hours (tornado) - Real time warnings: (hours to minutes) tsunami, earthquake shaking, hurricane, tornado, flood Sometimes these work, sometimes they fail
FAILURES False negative - unpredicted hazard Loss of life & property False positive - overpredicted hazard Wasted resources, public loses confidence Authorities typically ignore, deny, excuse, or minimize failure More useful to analyze failures to improve future performance
I am not discouraged, because every wrong attempt discarded is another step forward. Thomas Edison “We got a hell of a beating. We got run out of Burma and it is humiliating as hell. I think we ought to find out what caused it, go back, and retake it." General Joseph Stilwell U.S. Army, WWII
If it had been a weekday, Major cost
K. Emanuel CNN 8/26/11 NYT 8/28/11
Economic loss ? What if weekday?
Science News 6/15/91 The local economy collapsed, said Glenn Thompson, Mammoth Lakes' town manager. Housing prices fell 40 percent overnight. In the next fewyears, dozens of businesses closed, new shopping centers stood empty and townspeople left to seek jobs elsewhere. (NYT 9/11/90)
Predicted disaster probabilities are often very inaccurate P(sinking) = 0 P(loss) = 1/100,000
Underestimated uncertainty and bias(bandwagon effect) in measured speed of light Uncertainties are hard to assess and generally underestimated Systematic errors often exceed measurement errors 1875-1960
Number of human chromosome pairs 1921-1955: 24 Now: 23
NEGLECTING UNCERTAINTY OVERESTIMATES HAZARD 1976 SWINE FLU “APORKALPSE” CDC reported "strong possibility" of epidemic. HEW thought "chances seem to be 1 in 2” and“virus will kill one million Americans in 1976."President Ford launched program to vaccinate entire population despite critics’ reservations 40 million vaccinated at cost of millions of dollars before program suspended due to reactions to vaccine About 500 people had serious reactions and 25 died, compared to one person who died from swine flu
HAZARD OVERESTIMATED: Y2K Much ado made that on January 1, 2000 computer systems would fail, because dates used only two digits U.S. & other governments established major programs Estimated $300 billion spent on preparations Few major problems occurred, even among businesses and countries who made little or no preparation
Japan seemed ideal for hazard mapping Fast moving (80 mm/yr ) & seismically very active plate boundary with good instrumentation & long seismic history But: 2011 M 9.1 Tohoku, 1995 Kobe M 7.3 & others in areas mapped as low hazard In contrast: map assumed high hazard in Tokai “gap” Geller 2011
Hazard maps fail because of • - bad physics (incorrect description of earthquake processes) • bad assumptions (mapmakers’ choice of poorly known parameters) • bad data (lacking, incomplete, or underappreciated) • bad luck (low probability events) • and combinations of these
Detailed model of segments with 30 year probabilities Off Sanriku-oki North ~M8 0.2 to 10% Off Sanriku-oki Central ~M7.7 80 to 90% Assumption: No M > 8.2 Off Miyagi ~M7.5 > 90% Off Fukushima ~M7.4 7% Off Ibaraki ~M6.7 – M7.2 90% Sanriku to Boso M8.2 (plate boundary) 20% Sanriku to Boso M8.2 (Intraplate) 4-7% Expected Earthquake Sources 50 to 150 km segments M7.5 to 8.2 (Headquarters for Earthquake Research Promotion) J. Mori
Giant earthquake broke all of the segments 2011 Tohoku Earthquake 450 km long fault, M 9.1 Expected Earthquake Sources 50 to 150 km segments M7.5 to 8.2 (Headquarters for Earthquake Research Promotion) (Aftershock map from USGS) J. Mori
Planning assumed maximum magnitude 8 Seawalls 5-10 m high Stein & Okal, 2011 NYT Tsunami runup approximately twice fault slip (Plafker, Okal & Synolakis 2004) M9 generates much larger tsunami CNN
Tsunami radiates energy perpendicular to fault Thus largest landward of highest slip patches http://www.coastal.jp/tsunami2011/index.php?FrontPage http://www.geol.tsukuba.ac.jp/~yagi-y/EQ/Tohoku/
Didn’t consider historical record of large tsunamis NYT 4/20/11
Lack of M9s in record seemed consistent with model that M9s only occur where lithosphere younger than 80 Myr subducts faster than 50 mm/yr (Ruff and Kanamori, 1980) Disproved by Sumatra 2004 M9.3 and dataset reanalysis (Stein & Okal, 2007) Short record at most SZs didn’t include larger multisegment ruptures Stein & Okal, 2011
Most plate motion assumed aseismic, as in Kuriles: Same plate pair, further north - expected only M8 Since 1952 largest thrust earthquakes M8 with average slip 2-3 m. Previous earthquake sequence ~100 years earlier, so inferred seismic slip rate 2-3 cm/yr This is 1/3 of plate motion predicted from relative motion models, so the remaining 2/3 was assumed to occur aseismically. Kanamori, 1977
By 2003, recognize larger (M9?), rarer, multisegment ruptures Nature, 2003 that account for much of the proposed aseismic slip 80 mm/yr convergence: M 8: 2.5 m / 100 yr = 25 mm/yr + M 9: 10 m / 500 yr = 20 mm/yr
1970’s optimism Scientists will “be able to predict earthquakes in five years.” Louis Pakiser U.S. Geological Survey, 1971 “We have the technology to develop a reliable prediction system already in hand.” Alan Cranston, U.S. senator, 1973 “The age of earthquake prediction is upon us” U.S. Geological Survey, 1975 Similar in Japan, China, USSR
Failed prediction: 1975 Palmdale Bulge SAF USGS director McKelvey stated that “a great earthquake” would occur “in the area ... possibly within the next decade” that might cause up to 12,000 deaths, 48,000 serious injuries, 40,000 damaged buildings, and up to $25 billion in damage. Systematic uncertainty of leveling data underestimated
Failed prediction: Parkfield M 5-6 earthquakes about every 22 years: 1857, 1881, 1901, 1922, 1934, and 1966 In 1985, USGS predicted next with 95% confidence by 1993 Occurred in 2004 (16 years late) Discounting misfit of 1934 quake predicted higher confidence
2010 M7 earthquake shaking much greater than predicted for next 500 years 2001 hazard map http://www.oas.org/cdmp/document/seismap/haiti_dr.htm 6 mm/yr fault motion
Accuracy of hazard map prediction depends on accuracy of answers assumed to hierarchy of four basic questions Where will large earthquakes occur? When will they occur? How large will they be? How strong will their shaking be? Uncertainty & map failure result because these are often poorly known
Wheredo we expect earthquakes? Can use Earthquake history Plate motions Geology GPS Often, we have to chose which to use Different choices lead to different predicted hazards
Slow plate boundary Africa-Eurasia convergence rate varies smoothly (5 mm/yr) NUVEL-1 Argus, Gordon, DeMets & Stein, 1989 Predicted hazard from historic seismicity is highly variable GSHAP 1999 Swafford & Stein, 2007
Slow plate boundary Africa-Eurasia convergence rate varies smoothly (5 mm/yr) NUVEL-1 Argus, Gordon, DeMets & Stein, 1989 Predicted hazard from historic seismicity is highly variable Likely overestimated near recent earthquakes, underestimated elsewhere 2003 M 6.3 2004 M 6.4 GSHAP 1999 Swafford & Stein, 2007
2008 Wenchuan earthquake (Mw 7.9) was not expected: map showed low hazard USGS
Hazard map - assumed steady state - relied on lack of recent seismicity Didn’t use GPS data showing 1-2 mm/yr Earthquakes prior to the 2008 Wenchuan event Aftershocks of the Wenchuan event delineating the rupture zone M. Liu
Long record needed to see real hazard 1933 M 7.3 1929 M 7.2 Swafford & Stein, 2007
Map depends greatly on assumptions & thus has large uncertainty GSC 1985 Concentrated hazard bull's-eyes at historic earthquake sites “Our glacial loading model suggests that earthquakes may occur anywhere along the rifted margin which has been glaciated.” Stein et al., 1979 2005 Diffuse hazard along margin
Peak Ground Acceleration10% probability of exceedance in 50 years(once in 500 yr) HUNGARY: ALTERNATIVE HAZARD MAPS Present Study Diffuse hazard inferred incorporating geology GSHAP (1999) Concentrated hazard inferred from historic seismicity alone Toth et al., 2004
Plate B Earthquakes at different time Plate A • Plate Boundary Earthquakes • Major fault loaded rapidly at constant rate • Earthquakes spatially focused & temporally quasi-periodic • Past is fair predictor • Intraplate Earthquakes • Tectonic loading collectively accommodated by a complex system of interacting faults • Loading rate on a given fault is slow & may not be constant • Earthquakes can cluster on a fault for a while then shift • Past can be poor predictor Stein, Liu & Wang 2009
New Madrid 1991: because paleoseismology shows large events in 900 & 1450 AD, like those of 1811-12 GPS studies started, expecting to find strain accumulating consistent with large (~M7) events ~500 years apart • Surprising result
Science, April 1999 Little or no motion! Seismicity migrates Recent cluster transient, possibly ending Hazard overestimated
Similar behavior in other continental interiors “Large continental interior earthquakes reactivate ancient faults … geological studies indicate that earthquakes on these faults tend to be temporally clustered and that recurrence intervals are on the order of tens of thousands of years or more.” (Crone et al., 2003)
Earthquakes in North China during the period prior to the period instrumental events Large events often pop up where there was little seismicity! Liu, Stein & Wang 2011 Beijing Bohai Bay Ordos Plateau Shanxi Graben 1303 Hongtong M 8.0 Weihi rift
Earthquakes in North China during the period prior to the period instrumental events Large events often pop up where there was little seismicity! Liu, Stein & Wang 2011 Beijing Bohai Bay Ordos Plateau Shanxi Graben Weihi rift 1556 Huaxian M 8.3
Earthquakes in North China during the period prior to the period instrumental events Large events often pop up where there was little seismicity! Liu, Stein & Wang 2011 Beijing Bohai Bay Ordos Plateau Shanxi Graben Weihi rift 1668 Tancheng M 8.5