ES100: Community Ecology
410 likes | 597 Views
ES100: Community Ecology. 8/22/07. What Controls Population Size and Growth Rate (dN/dt)?. Density-dependent factors: Intra-specific competition food Space contagious disease waste production Interspecific competition Other species interactions! Density-independent factors:

ES100: Community Ecology
E N D
Presentation Transcript
ES100:Community Ecology 8/22/07
What Controls Population Size and Growth Rate (dN/dt)? • Density-dependent factors: • Intra-specific competition • food • Space • contagious disease • waste production • Interspecific competition • Other species interactions! • Density-independent factors: • disturbance, environmental conditions • hurricane • flood • colder than normal winter
Types of Interactions • Competition • Predator-Prey • Mutualism • Commensalism
Competition Natural Selection minimizes competition!
= r * N (1 – ) N K N K K K K-N K dN dt dN dt dN dt • = r * N ( ) Species Interactions • How do we model them? • Start with logistic growth • = r * N ( - ) Use this equation for 2 different species
dN1 dt dN2 dt K1-N1 K1 K2-N2 K2 Species Interactions • Population 1 N1 • Population 2 N2 • But the growth of one population should have an effect the size of the other population • = r1 * N1 ( ) • = r2 * N2 ( )
Species Interactions • New term for interactions a12 effect of population 2 on population 1 a21 effect of population 1 on population 2 • Multiply new term by population size the larger population 2 is, the larger its effect on population 1 (and vice versa) a12 * N2 a21 * N1
dN1 dt dN2 dt Competition: Lotka-Volterra Model • If two species are competing, the growth of one population should reduce the size of the other • Population 1 N1 • Population 2 N2 K1 - N1 - a12 N2 K1 • = r1 * N1 K2 - N2 - a21 N1 K2 • = r2 * N2
dN1 dt dN2 dt Competition • If two species are competing, the growth of one population should reduce the size of the other • Population 1 N1 • Population 2 N2 Because this is a negative term, K is reduced K1 - N1 - a12 N2 K1 • = r1 * N1 K2 - N2 - a21 N1 K2 • = r2 * N2
COMPETITION Blue Area = Bluejay’s Carrying Capacity It takes 1squirrel to use the portion of the carrying capacity occupied by 4 bluejays. aBS = 4 Interspecific competition regulates bluejay population
COMPETITION Green Area = Squirrel’s Carrying Capacity It takes 4 bluejays to use the portion of the carrying capacity occupied by 1 squirrel. aSB =.25 Intraspecific competition regulates squirrel population
Outcomes of Competition Model • Many possible outcomes, depends on the balance of: • r1 vs r2 • K1 vs K2 • a21 vs a12 • a12 > 1 Interspecific competition dominates population size of species 1 • a12 < 1 Intraspecific competition dominates population size of species 1 a12 is the per capita effect of species 2 on the the pop’n growth rate of species 1, measured relative to the effect of species 1.
Predator-Prey Relationships • Prey defenses: avoid conflict! • coevolution • as predator evolves, prey evolves to evade it • warning coloration and mimicry • Camouflage
Predator-Prey Red = Fox’s Carrying Capacity It takes 10 rabbits to support 1 fox aFR =.10
Predator-Prey Yellow = Rabbits Carrying Capacity It takes 10 rabbits to support 1 fox aRF = 10
Predator-Prey Relationships • Bottom-up vs. Top-Down control • Predators can promote diversity by • keeping competition in check
dN1 dt dN2 dt Predatory-Prey • If it is a predator-prey relationship, then the two populations have opposite effects on one another • Prey (N1) • Predator (N2) Because this is a negative term, K is reduced K1 - N1 - a12 N2 K1 • = r1 * N1 Because this is a positive term, K is increased K2 - N2 + a21 N1 K2 • = r2 * N2
Mutualism • Both species benefit
dN1 dt dN2 dt Mutualism • If it is a mutually beneficial relationship, then the two populations increase each other’s size • Population 1 N1 • ti • Population 2 N2 Because this is a positive term, K is increased K1 - N1 + a12 N2 K1 • = r1 * N1 Because this is a positive term, K is increased K2 - N2 + a21 N1 K2 • = r2 * N2
Commensalism • One species benefits, the other is unaffected
dN1 dt dN2 dt Commensalism • If the relationship is commensalistic, one species benefits (the commensal) and the other is unaffected • Population 1 N1 • Population 2 N2 Because this is a positive term, K is increased K1 - N1 + a12 N2 K1 • = r1 * N1 Because there is no a21 term, K is unchanged K2 - N2 K2 • = r2 * N2
Assumptions of Lotka-Volterra Models • All assumptions of logistic growth model… plus: • Interaction coefficients, carrying capacities, and intrinsic growth rates are constant.
Summary of Interaction Equations: Competition: (- , -) Predator/Prey: (+, -) Mutualism: (+, +) Commensalism: (+, 0)
Test you knowledge! What type of relationship– what equation to use? • A coati eats tree fruit. • Your dog has a flea • You use a fast bicyclist to “draft” off of
Problems with Simple Logistic Growth • Births and deaths not separated -you might want to look at these processes separately -predation may have no effect on birth rate • Carrying capacity is an arbitrary, set value • No age structure
dN dt 1. Separate Births and Deaths = Births - Deaths Births = b*N Deaths = d*N Births and deaths may be density dependent
dN dt 1. Separate Births and Deaths = Births - Deaths Example: Births = b*N(1- N ) K Births = b*N Deaths = d*N Deaths = db+a21N2 Births rate may be density dependent Death rate may be dominated by predator effects
dNH dt NH NP 2. Refine Carrying Capacity If the population is a herbivore, K may depend on the population of plants Kherbivore= Nplant • = rH * NH (1 – )
Remaining Problems • Age Structure • Space: animals rely on different parts of landscape for different parts of their life cycle • Individuality: Populations are collections of individuals, not lumped pools
General Notes on Using Models • How complex should model be? K.I.S.S. • Identify research needs: • Build model structure • Test model to see what it is most sensitive to • Do research to find values of unknown parameters • If build a model that accurately predicts dynamics, it can be used as a management tool. • Look critically at assumptions!
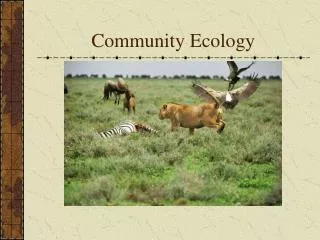
Community Dynamics Community: a group of populations (both plants and animals) that live together in a defined region.
Trophic Cascade Eagles 4th trophic level predator/ tertiary consumer predator/ secondary consumer Foxes 3rd trophic level herbivore/ primary consumer 2nd trophic level Mice autotroph/ primary producer Plants 1st trophic level
How would we Model the Fox Population? Why not include the effect of the plant population? What if foxes had a competitor?
Trophic Cascade Eagles 4th trophic level if eagles go extinct, what could happen to… foxes? mice? plants? Foxes 3rd trophic level 2nd trophic level Mice Plants 1st trophic level
Trophic Cascade Eagles 4th trophic level If a new predator on mice is introduced, what could happen to… mice? plants? foxes? eagles? Foxes 3rd trophic level 2nd trophic level Mice Plants 1st trophic level
Trophic Cascade Eagles 4th trophic level If drought caused a dip in plant production, what would happen to… mice? foxes? eagles? Foxes 3rd trophic level 2nd trophic level Mice Plants 1st trophic level
Simplified Temperate Forest Food WebWhat happens to when it’s a WEB instead of a CHAIN? Eagle Wolf Fox Shrews Deer Caterpillars Rabbit Oak seedling Grasses Herbs In long term, balance is restored
Food Web doesn’t account for Keystone Species Otters eat sea urchins Kelp provides otter habitat Sea urchins eat kelp
Summary • Modeling Species Interactions • Competition • Predator-prey • Mutualism • Commensalism • Community Dynamics • Food Webs • Keystone Species