Download

1 / 27
280 likes | 391 Views
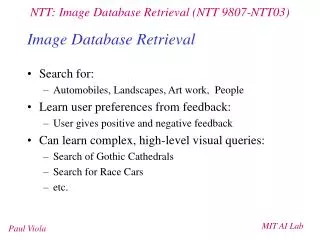
Evaluation of Image Retrieval Results. Relevant : images which meet user’s information need Irrelevant : images which don’t meet user’s information need. Query: cat. Relevant. Irrelevant. Accuracy. Given a query, an engine classifies each image as “Relevant” or “ Nonrelevant ”

E N D
Evaluation of Image Retrieval Results • Relevant: images which meet user’s information need • Irrelevant: images which don’t meet user’s information need Query: cat Relevant Irrelevant
Accuracy • Given a query, an engine classifies each image as “Relevant” or “Nonrelevant” • The accuracy of an engine: the fraction of these classifications that are correct • (tp + tn) / ( tp + fp + fn + tn) • Accuracy is a commonly used evaluation measure in machine learning classification work • Why is this not a very useful evaluation measure in IR?
Why not just use accuracy? • How to build a 99.9999% accurate search engine on a low budget…. • People doing information retrieval want to findsomething and have a certain tolerance for junk. Snoogle.com Search for: 0 matching results found.
Unranked retrieval evaluation:Precision and Recall • Precision: fraction of retrieved images that are relevant • Recall: fraction of relevant image that are retrieved Precision: P = tp/(tp + fp) Recall: R = tp/(tp + fn)
Precision/Recall • You can get high recall (but low precision) by retrieving all images for all queries! • Recall is a non-decreasing function of the number of images retrieved • In a good system, precision decreases as either the number of images retrieved or recall increases • This is not a theorem, but a result with strong empirical confirmation
A combined measure: F • Combined measure that assesses precision/recall tradeoff is F measure (weighted harmonic mean): • People usually use balanced F1measure • i.e., with = 1 or = ½ • Harmonic mean is a conservative average • See CJ van Rijsbergen, Information Retrieval
Evaluating ranked results • Evaluation of ranked results: • The system can return any number of results • By taking various numbers of the top returned images (levels of recall), the evaluator can produce a precision-recall curve
Interpolated precision • Idea: If locally precision increases with increasing recall, then you should get to count that… • So you take the max of precisions to right of value
Summarizing a Ranking • Graphs are good, but people want summary measures! • Precision and recall at fixed retrieval level • Precision-at-k: Precision of top k results • Recall-at-k: Recall of top k results • Perhaps appropriate for most of web search: all people want are good matches on the first one or two results pages • But: averages badly and has an arbitrary parameter of k
Summarizing a Ranking • Calculating precision at standard recall levels, from 0.0 to 1.0 • 11-point interpolated average precision • The standard measure in the early TREC competitions: you take the precision at 11 levels of recall varying from 0 to 1 by tenths of the images, using interpolation (the value for 0 is always interpolated!), and average them • Evaluates performance at all recall levels
Typical 11 point precisions • SabIR/Cornell 8A1 11pt precision from TREC 8 (1999)
Summarizing a Ranking • Average precision (AP) • Averaging the precision values from the rank positions where a relevant image was retrieved • Avoids interpolation, use of fixed recall levels • MAP for query collection is arithmetic average • Macro-averaging: each query counts equally
Summarizing a Ranking • Mean average precision (MAP) • summarize rankings from multiple queries by averaging average precision • most commonly used measure in research papers • assumes user is interested in finding many relevant images for each query
Summarizing a Ranking • R-precision • If we have a known (though perhaps incomplete) set of relevant images of size Rel, then calculate precision of the top Relimages returned • Perfect system could score 1.0.
Summarizing a Ranking for Multiple Relevance levels • NDCG: Normalized Discounted Cumulative Gain • Popular measure for evaluating web search and related tasks • Two assumptions: • Highly relevant images are more useful than marginally relevant image • the lower the ranked position of a relevant image, the less useful it is for the user, since it is less likely to be examined
Summarizing a Ranking for Multiple Relevance levels • DCG: Discounted Cumulative Gain • the total gain accumulated at a particular rank p: • Alternative formulation • emphasis on retrieving highly relevant images
Summarizing a Ranking for Multiple Relevance levels • DCG: Discounted Cumulative Gain • 10 ranked images judged on 0‐3 relevance scale: 3, 2, 3, 0, 0, 1, 2, 2, 3, 0 • discounted gain: 3, 2/1, 3/1.59, 0, 0, 1/2.59, 2/2.81, 2/3, 3/3.17, 0 = 3, 2, 1.89, 0, 0, 0.39, 0.71, 0.67, 0.95, 0 • DCG: 3, 5, 6.89, 6.89, 6.89, 7.28, 7.99, 8.66, 9.61, 9.61
Summarizing a Ranking for Multiple Relevance levels • NDCG • DCG values are often normalized by comparing the DCG at each rank with the DCG value for the perfect ranking • makes averaging easier for queries with different numbers of relevant images • Perfect ranking: 3, 3, 3, 2, 2, 2, 1, 0, 0, 0 • ideal DCG values: 3, 6, 7.89, 8.89, 9.75, 10.52, 10.88, 10.88, 10.88, 10 • NDCG values (divide actual by ideal): 1, 0.83, 0.87, 0.76, 0.71, 0.69, 0.73, 0.8, 0.88, 0.88 NDCG ≤1 at any rank position
Variance • For a test collection, it is usual that a system does crummily on some information needs (e.g., MAP = 0.1) and excellently on others (e.g., MAP = 0.7) • Indeed, it is usually the case that the variance in performance of the same system across queries is much greater than the variance of different systems on the same query. • That is, there are easy information needs and hard ones!
Significance Tests • Given the results from a number of queries, how can we conclude that ranking algorithm A is better than algorithm B? • A significance test enables us to reject the null hypothesis (no difference) in favor of the alternative hypothesis (B is better than A) • the power of a test is the probability that the test will reject the null hypothesis correctly • increasing the number of queries in the experiment also increases power of test