Information Retrieval Evaluation
Information Retrieval Evaluation. http://net.pku.edu.cn/~wbia 黄连恩 hle @net.pku.edu.cn 北京大学信息工程学院 1 0 / 29 /201 3. IR Evaluation Methodology. Measures for a search engine. 创建 index 的速度 Number of documents/hour Documents size 搜索的速度 响应时间: Latency as a function of index size


Information Retrieval Evaluation
E N D
Presentation Transcript
Information Retrieval Evaluation http://net.pku.edu.cn/~wbia 黄连恩 hle@net.pku.edu.cn 北京大学信息工程学院 10/29/2013
Measures for a search engine 创建index的速度 Number of documents/hour Documents size 搜索的速度 响应时间:Latency as a function of index size 吞吐率:Throughput as a function of index size 查询语言的表达能力 Ability to express complex information needs Speed on complex queries These criteriameasurable. 但更关键的measure是 user happiness 怎样量化的度量它? 3
Measuring user happiness Issue: 谁是user? Web engine: user finds what they want and return to the engine Can measure rate of return users eCommerce site: user finds what they want and make a purchase Is it the end-user, or the eCommerce site, whose happiness we measure? Measure time to purchase, or fraction of searchers who become buyers? Enterprise (company/govt/academic): Care about “user productivity” How much time do my users save when looking for information? Many other criteria having to do with breadth of access, secure access, etc. 4
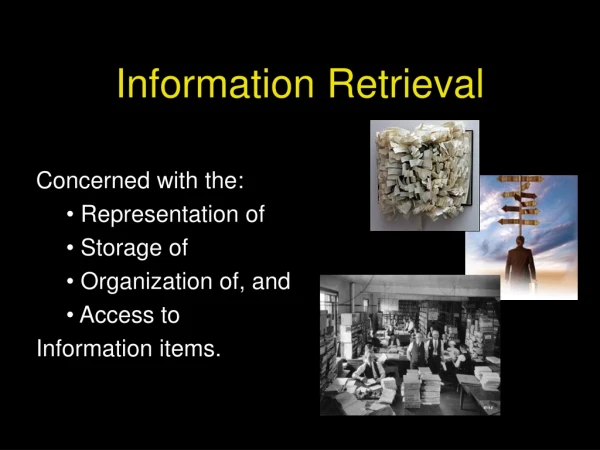
Happiness: elusive to measure Commonest proxy: relevance of search results But how do you measure relevance? Methodology: test collection(corpus) A benchmark document collection A benchmark suite of queries A binary assessment of either Relevant or Irrelevant for each query-doc pair Some work on more-than-binary, but not the standard 5
Evaluating an IR system Note: the information need is translated into a query, Relevance is assessed relative to the information neednot thequery E.g., Information need: I'm looking for information on whether drinking red wine is more effective at reducing your risk of heart attacks than white wine. Query: wine red white heart attack effective You evaluate whether the doc addresses the information need, not whether it has those words 6
Evaluation Corpus • TREC - National Institute of Standards and Testing (NIST) has run a large IR test bed for many years • Test collections consisting of documents, queries, and relevance judgments, e.g., • CACM: Titles and abstracts from the Communications of the ACM from 1958-1979. Queries and relevance judgments generated by computer scientists. • AP: Associated Press newswire documents from 1988-1990 (from TREC disks 1-3). Queries are the title fields from TREC topics 51-150. Topics and relevance judgments generated by government information analysts. • GOV2: Web pages crawled from websites in the .gov domain during early 2004. Queries are the title fields from TREC topics 701-850. Topics and relevance judgments generated by government analysts. 7/N
Test Collections 8/N
Relevance Judgments • Obtaining relevance judgments is an expensive, time-consuming process • who does it? • what are the instructions? • what is the level of agreement? • TREC judgments • depend on task being evaluated • generally binary • agreement good because of “narrative” 10/N
Pooling • Exhaustive judgments for all documents in a collection is not practical • Pooling technique is used in TREC • top k results (for TREC, k varied between 50 and 200) from the rankings obtained by different search engines (or retrieval algorithms) are merged into a pool • duplicates are removed • documents are presented in some random order to the relevance judges • Produces a large number of relevance judgments for each query, although still incomplete 11/N
Unranked retrieval evaluation:Precision and Recall Precision: 检索得到的文档中相关的比率 = P(relevant|retrieved) Recall: 相关文档被检索出来的比率 = P(retrieved|relevant) 精度Precision P = tp/(tp + fp) 召回率Recall R = tp/(tp + fn) 13
Accuracy 给定一个Query,搜索引擎对每个文档分类classifies as “Relevant” or “Irrelevant”. Accuracy of an engine: 分类的正确比率. Accuracy = (tp + tn)/(tp + fp +tn + fn) Is this a very useful evaluation measure in IR? 14
Why not just use accuracy? How to build a 99.9999% accurate search engine on a low budget…. People doing information retrieval want to findsomething and have a certain tolerance for junk. Snoogle.com Search for: 0 matching results found. 15
Precision and recall when ranked 把集合上的定义扩展到ranked list 在ranked list中每个文档处,计算P/R point 这样计算出来的值,那些是有用的? Consider a P/R point for each relevant document Consider value only at fixed rank cutoffs e.g., precision at rank 20 Consider value only at fixed recall points e.g., precision at 20% recall May be more than one precision value at a recall point 16
Average precision of a query Often want a single-number effectiveness measure Average precision is widely used in IR Calculate by averaging precision when recall increases 18
Recall/precision graphs Average precision .vs. P/R graph AP hides information Recall/precision graph has odd saw-shape if done directly 但是P/R图很难比较 19
Averaging graphs: a false start How can graphs be averaged? 不同的queries有不同的recall values What is precision at25% recall? 插值interpolate How? 21
Interpolation of graphs 可能的插值方法 No interpolation Not very useful Connect the dots Not a function Connect max Connect min Connect average … 0%recall怎么处理? Assume 0? Assume best? Constant start? 22
How to choose? 一个好的检索系统具有这样的特点:一般来说(On average),随着recall增加, 它的precision会降低 Verified time and time again On average 插值,使得makes function monotonicallydecreasing 比如: 从左往右,取右边最大precisions值为插值 where S is the set of observed (R,P) points 结果是一个step function 23
Our example, interpolated this way monotonically decreasing Handles 0% recall smoothly 24
Averaging graphs: using interpolation Asked: what is precision at 25% recall? Interpolate values 25
Averaging across queries 多个queries间的平均 微平均Micro-average – 每个relevant document 是一个点,用来计算平均 宏平均Macro-average – 每个query是一个点,用来计算平均 Average of many queries’ average precision values Called mean average precision (MAP) “Average average precision” sounds weird Most common 26
Interpolated average precision Average precision at standard recall points For a given query, compute P/R point for every relevant doc doc. Interpolate precision at standard recall levels 11-pt is usually 100%, 90, 80, …, 10, 0% (yes, 0% recall) 3-pt is usually 75%, 50%, 25% Average over all queries to get average precision at each recall level Average interpolated recall levels to get single result Called “interpolated average precision” Not used much anymore;MAP “mean average precision” more common Values at specific interpolated points still commonly used 27
A combined measure: F P/R的综合指标F measure (weightedharmonic mean): 通常使用balanced F1measure( = 1 or = ½) Harmonic mean is a conservative average,Heavily penalizes low values of P or R 29
Averaging F, example Q-bad has 1 relevant document Retrieved at rank 1000 (R P) = (1, 0.001) F value of 0.2%, so AvgF = 0.2% Q-perfect has 10 relevant documents Retrieved at ranks 1-10 (R,P) = (.1,1), (.2,1), …, (1,1) F values of 18%, 33%, …, 100%, so AvgF = 66.2% Macro average (0.2% + 66.2%) / 2 = 33.2% Micro average (0.2% + 18% + … 100%) / 11 = 60.2% 30
Focusing on Top Documents • Users tend to look at only the top part of the ranked result list to find relevant documents • Some search tasks have only one relevant document • e.g., navigational search, question answering • Recall not appropriate • instead need to measure how well the search engine does at retrieving relevant documents at very high ranks 31/N
Focusing on Top Documents • Precision at N • Precision at Rank R • R typically 5, 10, 20 • easy to compute, average, understand • not sensitive to rank positions less than R • Reciprocal Rank • reciprocal of the rank at which the first relevant document is retrieved • Mean Reciprocal Rank (MRR) is the average of the reciprocal ranks over a set of queries • very sensitive to rank position 32/N
Discounted Cumulative Gain • Popular measure for evaluating web search and related tasks • Two assumptions: • Highly relevant documents are more useful than marginally relevant document • the lower the ranked position of a relevant document, the less useful it is for the user, • since it is less likely to be examined 33/N
Discounted Cumulative Gain • Uses graded relevanceas a measure of the usefulness, or gain, from examining a document • Gain is accumulated starting at the top of the ranking and may be reduced, or discounted, at lower ranks • Typical discount is 1/log (rank) • With base 2, the discount at rank 4 is 1/2, and at rank 8 it is 1/3 34/N
Discounted Cumulative Gain • DCG is the total gain accumulated at a particular rank p: • Alternative formulation: • used by some web search companies • emphasis on retrieving highly relevant documents 35/N
DCG Example • 10 ranked documents judged on 0-3 relevance scale: 3, 2, 3, 0, 0, 1, 2, 2, 3, 0 • discounted gain: 3, 2/1, 3/1.59, 0, 0, 1/2.59, 2/2.81, 2/3, 3/3.17, 0 = 3, 2, 1.89, 0, 0, 0.39, 0.71, 0.67, 0.95, 0 • DCG: 3, 5, 6.89, 6.89, 6.89, 7.28, 7.99, 8.66, 9.61, 9.61 36/N
Normalized DCG • DCG values are often normalized by comparing the DCG at each rank with the DCG value for the perfect ranking • makes averaging easier for queries with different numbers of relevant documents 37/N
NDCG Example • Perfect ranking: 3, 3, 3, 2, 2, 2, 1, 0, 0, 0 • ideal DCG values: 3, 6, 7.89, 8.89, 9.75, 10.52, 10.88, 10.88, 10.88, 10 • NDCG values (divide actual by ideal): 1, 0.83, 0.87, 0.76, 0.71, 0.69, 0.73, 0.8, 0.88, 0.88 • NDCG £ 1 at any rank position 38/N
Using Preferences • Two rankings described using preferences can be compared using the Kendall tau coefficient (τ ): • P is the number of preferences that agree and Q is the number that disagree • For preferences derived from binary relevance judgments, can use BPREF 39/N
Significance Tests • Given the results from a number of queries, how can we conclude that ranking algorithm A is better than algorithm B? • A significance test enables us to reject the null hypothesis (no difference) in favor of the alternative hypothesis (B is better than A) • the power of a test is the probability that the test will reject the null hypothesis correctly • increasing the number of queries in the experiment also increases power of test 41/N
One-Sided Test • Distribution for the possible values of a test statistic assuming the null hypothesis • shaded area is region of rejection 42/N
t-Test • Assumption is that the difference between the effectiveness values is a sample from a normal distribution • Null hypothesis is that the mean of the distribution of differences is zero • Test statistic • for the example, 44/N
Sign Test • Ignores magnitude of differences • Null hypothesis for this test is that • P(B > A) = P(A > B) = ½ • number of pairs where B is “better” than A would be the same as the number of pairs where A is “better” than B • Test statistic is number of pairs where B>A • For example data, • test statistic is 7, p-value = 0.17 • cannot reject null hypothesis 45/N
Online Testing • Test (or even train) using live traffic on a search engine • Benefits: • real users, less biased, large amounts of test data • Drawbacks: • noisy data, can degrade user experience • Often done on small proportion (1-5%) of live traffic 46/N
本次课小结 IR evaluation Precision, Recall, F Interpolation MAP, interpolated AP P@N,P@R DCG,NDCG BPREF 47
Thank You! Q&A
阅读材料 [1] IIR Ch1,Ch6.2,Ch6.3,Ch8.1,8.2,8.3,8.4 [2] M. P. Jay and W. B. Croft, "A language modeling approach to information retrieval," in Proceedings of the 21st annual international ACM SIGIR conference on Research and development in information retrieval. Melbourne, Australia: ACM Press, 1998. 49
习题 8-9 [**] 在10,000篇文档构成的文档集中,某个查询的相关文档总数为8,下面给出了某系统针对该查询的前20个有序结果的相关(用R表示)和不相关(用N表示)情况,其中有6篇相关文档: • RRNNN • NNNRN • RNNNR • NNNNR • a. 前20篇文档的正确率是多少? • b. 前20篇文档的F1值是多少? • c. 在25%召回率水平上的插值正确率是多少?