CFEE Conference
CFEE Conference. State & Local Authority. What We Have, and What We Need. March 23 rd , 2007 By: Jim Madaffer. Presentation Outline. What We Have I-15 SR-125 What We Need New Opportunities. By the Numbers… Grew from 1,000 to 20,000 customers Over 10 million trips processed


CFEE Conference
E N D
Presentation Transcript
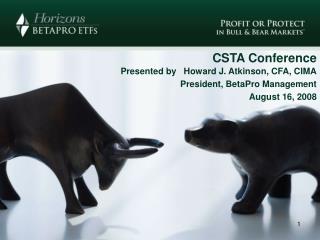
CFEE Conference State & Local Authority What We Have, and What We Need March 23rd, 2007 By: Jim Madaffer
Presentation Outline • What We Have • I-15 • SR-125 • What We Need • New Opportunities
By the Numbers… Grew from 1,000 to 20,000 customers Over 10 million trips processed Over $15 million in tolls collected Over $7 million in transit subsidy Over 1 million transit passengers Growth 1996 – Present … Average Daily Traffic (ADT) has increased by more than 100% HOV use has increased by 45% = VTMS = CMS Where We’ve BeenPast 10 Years
Typical fee range is $0.50 to $4.00, with $8.00 maximum toll (Ex.) Pricing Table Dynamic Variable Pricing • Per-trip pricing using FasTrakTM electronic toll collection began in April 1998 • First project to employ dynamic variable pricing • Fees derived from volume of vehicles in Express Lanes; set to keep traffic free flowing
Number of People per Hour Per Lane on I-15 3,000 2,500 2,100 More People During Average P.M. Commute 2,000 1,500 1,000 2:00 PM 2:30 PM 3:00 PM 3:30 PM 4:00 PM 4:30 PM 5:00 PM 5:30 PM 6:00 PM 6:30 PM General Purpose Lane Managed Lane Peak Hour Throughput
Approve 66% Approve 88% Disapprove 28% Don’t Know 6% Other I-15 Users Disapprove 11% Don’t Know 1% FasTrak Customer Public Support for Managed Lanes • Conducted public outreach • Stakeholder interviews • Phone / Intercept Surveys • Focus Groups Approval of FasTrak Program By Group
Approval of FasTrak Program By Age, Ethnicity, and Income Income ($000’s) Age Ethnicity Approval of FasTrak Program
By the Numbers… Managed Lanes Project, constructed in 3 stages (middle, north, and south) Total length = 20 miles Four-lane concurrent (NB/SB) flow with movable barrier Project cost: over $1 billion ML FasTrak Projections… Over 6 million toll transactions expected each year (after 2012) Between $7 million to $9 million in revenue per year (after 2012) = Stations / Direct Access Ramps Where We’re HeadedI-15 Managed Lanes
Existing & NewOpportunities • Existing Toll Road (SR-125) • Existing Value Pricing Corridor • New Value Pricing Corridors • Possible New Toll Roads
Lessons Learned • There is public support for congestion pricing. • Pricing works as a congestion management tool. • Corridor-level public outreach and market research is needed. • Given growing demands and constrained revenues, new tools such as pricing and tolling are needed. • Need Authority at the State Level to expand the concept.