Measurement Reliability
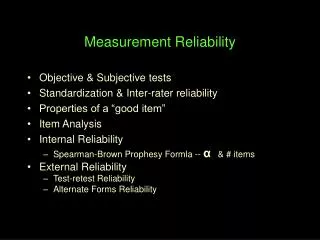
Measurement Reliability. Objective & Subjective tests Standardization & Inter-rater reliability Properties of a “good item” Item Analysis Internal Reliability Spearman-Brown Prophesy Formla -- α & # items External Reliability Test-retest Reliability Alternate Forms Reliability.

Measurement Reliability
E N D
Presentation Transcript
Measurement Reliability • Objective & Subjective tests • Standardization & Inter-rater reliability • Properties of a “good item” • Item Analysis • Internal Reliability • Spearman-Brown Prophesy Formla -- α& # items • External Reliability • Test-retest Reliability • Alternate Forms Reliability
“Objective” vs. “Subjective” Tests • One of the first properties of a measure that folks look at • There are different meanings, or components, to this distinction • Data Source • mechanical instrumentation give “objective” data (e.g., counters) • noninstrumented measures give “subjective” data (e.g. observer ratings) • Response Options • closed-ended responses are “objective” (e.g., MC, T&F, matching) • open-ended responses are “subjective” (e.g. FiB, essay) • Response Processing • response = data is “objective” (e.g., age) • response coded into data is “subjective” (e.g., scoring or grading)
We need to assess the inter-rater reliability of the scores from “subjective” items. • Have two or more raters score the same set of tests (usually 25-50% of the tests) • Assess the consistency of the scores different ways for different types of items • Quantitative Items • correlation, intraclass correlation, RMSD • Ordered & Categorical Items • Cohen’s Kappa • Keep in mind what we really want is “rater validity” • we don’t really want raters to agree, we want then to be right! • so it is best to compare raters with a “standard” rather than just with each other
Ways to improve inter-rater reliability… • improved standardization of the measurement instrument • do questions focus respondent’s answers? • will “single sentence” or or other response limitations help? • instruction in the elements of the standardization • is complete explication possible? (borders on “objective”) • if not, need “conceptual matches” • practice with the instrument -- with feedback • “walk-throughs” with experienced coders • practice with “common problems” or “historical challenges” • experience with the instrument • really no substitute • have to worry about “drift” & “generational reinterpretation” • use of the instrument to the intended population • different populations can have different response tendencies
Properties of a “Good Item” • Each item must reflect the construct/attribute of interest • “content validity is assured not assessed” • Each item should be positively related to the construct/attribute of interest (“positively monotonic”) Scatter plot of each persons score in the item and construct perfect item great item common items bad items Item Response Lower Higher Lower values Higher Values Construct of Interest
But, there’s a problem … • We don’t have scores on “the construct/attribute” • So, what do we do ??? • Use our best approximation of each person’s construct/attribute score -- which is … • Their composite score on the set of items written to reflect that construct/attribute • Yep -- we use the set of untested items to make decisions about how “good” each of the items is… • But, how can this work ??? • We’ll use an iterative process • Not a detailed analysis -- just looking for “really bad” items
Process for Item Analysis • 1st Pass • compute a total score from the set of items written to reflect the specific construct/attribute • recode the total score into five ordered categories • divide the sample into five groups (low to high total scores) • for each item • plot the means of the five groups on the item • look for items that are “flat” “quadratic” or “backward” • drop “bad items” -- don’t get carried away -- keep all you can • 2nd Pass • compute a new total from the items you kept • re-recode the new total score into 5 categories • replot all the items (including the ones dropped on 1st pass) • Additional Passes • repeat until “stable”
Internal Reliability • The question of internal reliability is whether or not the set of items “hangs together” or “reflects a central construct”. • If each item reflects the same “central construct” then the aggregate (sum or average) of those items ought to provide a useful score on that construct • Ways of Assessing Internal Reliability • Split-half reliability • the items were randomly divided into two half-tests and the scores of the two half-tests were correlated • high correlations (.7 and higher) were taken as evidence that the items reflect a “central construct” • split-half reliability is “easily” done by hand (before computers) but has been replaced by ...
Chronbach’s -- a measures of the consistency with which individual items inter-relate to each other • i R - i i = # items = ------- * --------- R = average correlation i - 1 R among the items • From this formula you can see two ways to increase the internal consistency of a set of items • increase the similarity of the items • will increase their average correlation - R • increase the number of items • -values range from 0 - 1.00 (larger is better) • “good” values are .6 - .7 and above
Assessing using SPSS Item corrected alpha if item-total rdeleted i1 .1454 .63 i2 .2002 .58 i3 -.2133 .71 i4 .1882 .59 i5 .1332 .62 i6 .2112 .56 i7 .1221 .60 Coefficient Alpha =.58 • Correlation between each item and a total comprised of all the other items (except that one) • negative item-total correlations indicate either... • very “poor” item • reverse keying problems • What the alpha would be if that item were dropped • drop items with alpha if deleted larger than alpha • don’t drop too many at a time !! Tells the for this set of items Usually do several “passes” rather that drop several items at once.
Assessing using SPSS Item corrected alpha if item-total r deleted i1 .1454 .63 i2 .2002 .58 i3 -.2133 .71 i4 .1882 .59 i5 .1332 .62 i6 .2112 .56 i7 .1221 .60 Coefficient Alpha = .58 • Pass #1 • All items with “-” item-total correlations are “bad” • check to see that they have been keyed correctly • if they have been correctly keyed -- drop them • notice this is very similar to doing an item analysis and looking for items within a positive monotonic trend
Assessing using SPSS Item corrected alpha if item-total r deleted i1 .1612 .74 i2 .2202 .68 i4 .1822 .70 i5 .1677 .74 i6 .2343 .64 i7 .1121 .76 Coefficient Alpha = .71 • Pass #2, etc • Check that there are now no items with “-” item-total corrs • Look for items with alpha-if-deleted values that are substantially higher than the scale’s alpha value • don’t drop too many at a time • probably i7 • probably not drop i1 & i5 • recheck on next “pass” • it is better to drop 1-2 items on each of several “passes”
Whenever we’ve considered research designs and statistical conclusions, we’ve always been concerned with “sample size” • We know that larger samples (more participants) leads to ... • more reliable estimates of mean and std, r, F & X2 • more reliable statistical conclusions • quantified as fewer Type I and II errors • The same principle applies to scale construction - “more is better” • but now it applies to the number of items comprising the scale • more (good) items leads to a better scale… • more adequately represent the content/construct domain • provide a more consistent total score (respondent can change more items before total is changed much) • In fact, there is a formulaic relationship between number of items and (how we quantify scale reliability) • the Spearman-Brown Prophesy Formula
Here are the two most common forms of the formula… Note:X = reliability of test/scale K = desired reliability k = by what factor you must lengthen test to obtain K K * (1 - X) k = ------------------ X * (1 - K ) Starting with reliability of the scale (X), and desired reliability (K), estimate by what factor you must lengthen the test to obtain the desired reliability (k) Starting with reliability of scale (X), estimate the resulting reliability (K) if the test length were increased by a certain factor (k) k * X K = -------------------- 1 + ((k-1) * X)
Examples -- You have a 20-item scale with X = .50 • how many items would need to be added to increase the scale reliability to .70? • k is a multiplicative factor -- NOT the number of items to add • to reach K , we will need 20 * k = 20 * 2.33 = 46.6 = 47 items • so we must add 27 new items to the existing 20 items • Please Note: • This use of the formula assumes that the items to be added are “as good” as the items already in the scale (I.e., have the same average inter-item correlation -- R) • This is unlikely!! You wrote items, discarded the “poorer” ones during the item analysis, and now need to write still more that are as good as the best you’ve got ??? K * (1 - X) .70 * (1 - .50) k = ------------------ = ------------------- = 2.33 X * (1 - K ) .50 * (1 - .70)
Examples -- You have a 20-item scale with X = .50 • to what would the reliability increase if we added 30 items? • k = (# original + # new ) / # original = (20 + 30) / 20 = 2.5 • Please Note: • This use of the formula assumes that the items to be added are “as good” as the items already in the scale (i.e., have the same average inter-item correlation -- R) • This is unlikely!! You wrote items, discarded the “poorer” ones during the item analysis, and now need to write still more that are as good as the best you’ve got ??? So, this is probably an over-estimate of the resulting if we were to add 30 items. k * X 2.5 * .50 K = -------------------- = ------------------------- = .71 1 + ((k-1) * X) 1 + ((2.5-1) * .50)
External Reliability Test-Retest Reliability • Consistency of scores if behavior hasn’t changed • can examine score consistency if behavior has changed! • Test-Retest interval is usually 2 weeks to 6 months • need “response forgetting” but not “behavior change” • Two importantly different components involved… • response consistency – is the behavior consistent? • score consistency – does the test capture that consistency? • The key to assessing test-retest reliability is to recognize that we depend upon tests to give us the “right score” for each person. • The score can’t be “right” if it isn’t consistent -- same score • For years, assessment of test-retest reliability was limited to correlational analysis (r > .70 is “good”) • … but we’ll consider if this is really sufficient
External Reliability Alternate Forms Reliability • Sometimes it is useful to have “two versions” of a test -- called alternate forms • If the test is used for any type of “before vs. after” evaluation • Can minimize “sensitization” and “reactivity • Alternate Forms Reliability is assessed similarly to test-retest validity • The key to assessing test-retest reliability is to recognize that we depend upon tests to give us the “right score” for each person. • the two forms are administered - usually at the same time • For years, assessment of test-retest reliability was limited to correlational analysis (r > .70 is “good”) • … but we’ll consider if this is really sufficient • (note the parallel with test-retest reliability)
External Reliability You can gain substantial information by giving a test-retest of the alternate forms Fa_t1 Fb-t1 Fa-t2 Fb-t2 Test-retest evaluations Fa_t1 Fb-t1 Fa-t2 Fb-t2 Mixed Evaluations Usually find that ... AltF > T-Retest > Mixed Why? Alternate forms evaluations
Evaluating External Reliability • The key to assessing test-retest reliability is to recognize that we must assess what we want the measure to tell us… • sometimes we primarily want the measure to “line up” the respondents, so we can compare this order with how they line up on some other attribute • this is what we are doing with most correlational research • if so, then a “reliable measure” is one that lines up respondents the same each time • assess this by simple correlating test-retest or alt-forms scores • other times we are counting on the actual “score” to be the same across time or forms • if so, even r = 1.00 is not sufficient (means could still differ) • “similar scores” is demonstrated by a combination of … • good correlation (similar rank orders) • no mean difference (similar center to the rankings)
Here’s a scatterplot of the test (x-axis) re-test (y-axis) data… retest scores 50 r = .80 30 t = 3.2, p<.05 10 10 30 50 test scores Good test-retest correlation What’s “good” about this result ? Substantial mean difference -- folks tended to have retest scores lower than their test scores What’s “bad” about this result ?
Here’s a another…. retest scores 50 r = .30 30 t = 1.2, p>.05 10 10 30 50 test scores Good mean agreement ! What’s “good” about this result ? What’s “bad” about this result ? Poor test-retest correlation !
Here’s a another…. retest scores 50 r = .80 30 t = 1.2, p>.05 10 10 30 50 test scores Good mean agreement and good correlation! What’s “good” about this result ? What’s “bad” about this result ? Not much !