Download
1 / 23
230 likes | 426 Views
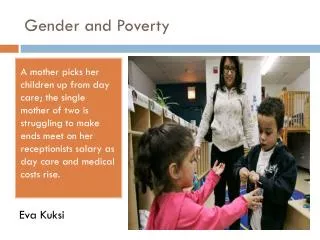
Children, Poverty and Health Care Utilization: Research and Implications. Ted McNeill PhD., RSW Canadian Public Health Association Conference Halifax, June 2, 2008. Objectives. Background: Poverty and child health Research: Poverty and child health at SickKids Discussion.

E N D
Children, Poverty and Health Care Utilization: Research and Implications Ted McNeill PhD., RSW Canadian Public Health Association Conference Halifax, June 2, 2008
Objectives • Background: Poverty and child health • Research: Poverty and child health at SickKids • Discussion
Source: Innocenti Research Centre. (2005). Child poverty in rich countries, 2005, Innocenti report card No.6. Florence: Innocenti Research Centre. Most data are from the years 1998-2000.
The growing income divide in Canada… From 1995 to 2005, GDP per capita in Canada grew by 27% in real dollars. • The highest 20% of families saw after-tax incomes grow by more than 22%. • The lowest 20% saw gains of 9%. Campaign 2000, Summoned to Stewardship (2007)
Social Determinants of Health “….remarkable sensitivity of health to the social environment and to what have become known as the social determinants of health.” (WHO, The Solid Facts, 2003)
Children, Povertyand Health • Canadian children living in low-income families are more likely to experience: • greater incidence of a variety of illnesses • hospital stays • accidental injuries • mental health problems • lower school achievement and early drop-out • family violence and child abuse (Canadian Institute for Child Health, 2000)
Dr.David McKeown(Medical Officer of Health, Toronto) • “Poverty is a major threat to health in Toronto. Compared to people with higher incomes, people living in poverty have: • less access to nutritious food and physical activity; • more exposure to pollution; • more infections; • more heart disease, diabetes, mental illness and cancer; • smaller babies; • and shorter lives” • “These health impacts of poverty are preventable. Eliminating poverty is the best medicine money can buy.” (2008)
Poverty in Toronto • Dramatic increase from 30 to 120 “high poverty” neighbourhoods between 1981 and 2001. • "High poverty neighbourhood" is defined as having 26% to 72.8% of families who have incomes <LICO* (*Stats Canada Low Income Cut-Off) Poverty by Postal Code, United Way of Toronto, (2004)
Research re: SickKid’s patients • What do we know about children at SickKids from high poverty neighbourhoods?
Methodology • Partnered with United Way to use their “Poverty by Postal Code” data to map to SickKid’s data • “High poverty neighbourhoods” are defined as having 26% 72.8% of families below Stats Canada’s Low Income Cut-Offs (LICO) • They comprise 43/97 Toronto postal codes and approximately 120/500 neighbourhoods • Comparison group: Other Toronto neighbourhoods that have 0% to 25.9% of families below LICO (54/97 postal codes and 380/500 neighbourhoods)
Sick Kids: Care Activities by Neighbourhood Sick Kid’s data from Apr 1/06 – Sept 30/07 prepared by Majid Kiakojouri, Health Records
Sick Kids:Complexity of Cases by Neighbourhood Based on data from Apr 1/06 – June 30/07 prepared by Majid Kiakojouri, Health Records
Sick Kids:Utilization and Resource Intensity… Based on 120 ‘high poverty’ neighbourhoods where the number of families below LICO* is 26 – 50% (72.8) *Stats Canada Low Income Cut-Off Based on all other neighbourhoods in Toronto (approximately 380) where number of families below LICO is 0 – 25.9% Based on data from Apr 1/06 – June 30/07 prepared by Majid Kiakojouri, Health Records
Readmissions… Based on 2007 data (Majid Kiakojouri, Health Records)
“No shows….”(All clinics reporting) Based on 2007 data (Majid Kiakojouri, Health Records)
Results summary • Children and families from ‘high poverty neighbourhoods’ in Toronto constitute: • 56% of Admissions • 7.6 versus 6.0 average LOS • 62% of Total Length of Stay • 63% of Total Weighted Cases • 2.0 versus 1.5 Resource Intensity Weighting • 56% - 64% of unplanned Re-admissions • 50% of Clinic visits • 60% of missed Clinic appointments
Models for Understanding Health • Biomedical • Genetics, microbiology, medical care, etc. • Lifestyle/Behavioural • Weight, alcohol use, diet, smoking, exercise, etc. • Social determinants of health • Political, economic and social factors
How does poverty “get under the skin?” • Materialist approach • Neo-materialist approach • Social comparison approach
From the field of psychoneuroimmunology…. “An explosion of research over the last two decades… has documented the mechanisms through which stressful emotions alter white blood cell function…” “Stress diminishes white blood cell response to viral infected cells, cancer cells, and some types of autoimmune disease… vaccination is less effective, wounds heal less readily…” (Littrell, 2008)