Download
1 / 42
420 likes | 539 Views
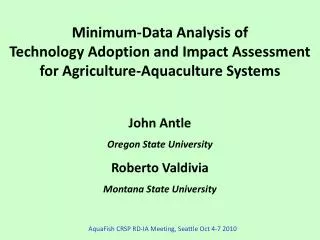
Minimum-Data Analysis of Technology Adoption and Impact Assessment for Agriculture-Aquaculture Systems John Antle Oregon State University Roberto Valdivia Montana State University. AquaFish CRSP RD-IA Meeting, Seattle Oct 4-7 2010. Reminder: Our Goals. Learn about data, model for IA

E N D
Minimum-Data Analysis of Technology Adoption and Impact Assessment for Agriculture-Aquaculture Systems John Antle Oregon State University Roberto Valdivia Montana State University AquaFish CRSP RD-IA Meeting, Seattle Oct 4-7 2010
Reminder: Our Goals • Learn about data, model for IA • Design IA for AquaFish investigations • Plan data collection • What data do we need? • Does your project have data? • Do you need to collect more data? • Set up a work plan for data collection and preparation. • Plan analysis & presentations
Impact Assessment using the TOA-MD model • Technology Adoption leads to Impacts • Define the relevant farm populations • Describe existing system and new system(s) based on improved technology (without vs with, baseline vs counterfactual) • Simulate adoption of new system(s) in the farm populations • Quantify impacts of adoption using Indicators
Logical structure of TOA-MD: Adoption analysis Adoption Sub-populations: non-adopters (base tech & indicators) adopters (improved tech, indicators) Farm population w/base tech & base indicators (poverty, sustainability) Result: r% adopters, (1-r)% non-adopters
Logical structure of TOA-MD: Impact analysis Example: Poverty System 1 income distribution (Poverty = 65%) System 2 income distribution (Poverty = 25%) r% adopters 1-r% non-adopters System 1 & 2 income distribution (Poverty = 45% )
TOA-MD Components Design Population (Strata) System characterization Impact indicator design Data Opportunity cost distribution Outcome distributions Simulation Indicators and Tradeoffs Adoption rate
Design • Populations and strata • Spatial: agro-ecozones, political units, watersheds, location • Socio-economic: farm size, wealth, age, gender • Systems • Crop, livestock, aquaculture subsystems • Sub-systems composed of activites • Farm household • Impact indicators • Population mean
Design (cont.) • Impact indicators • Economic • Mean farm or per capita income • Poverty • Environmental • On-farm: soil quality • Off-farm: water quality, GHG emissions • Social • Nutrition • Health • Intra-household distribution
Design (cont.) • Indicator design • Population means • Probability of exceeding a threshold • Headcount poverty: % below poverty line • Nutritional threshold • Environmental threshold
TOA-MD Components Design Population (Strata) System characterization Impact indicator design Data Opportunity cost distribution Outcome distributions
Data • Economic • Farmed area in each stratum (ha) • Population mean net returns for each system in each stratum • Yield, price, costs of production, and land allocation to each activity in each system • Or … direct observation of returns to the whole system • Standard deviation of net returns by system and stratum • Correlation between returns to each system • Environmental and social • Mean and CV for each outcome for each system • Correlation with net returns
Data (cont.) • Household: means and CVs for • Farm (ha), herd (head or TLU) and pond (ha) sizes • Family size (number of persons) • Non-agricultural income
TOA-MD Components Design Population (Strata) System characterization Impact indicator design Data Opportunity cost distribution Outcome distributions Simulation Indicators and Tradeoffs Adoption rate
Simulation • Adoption • Baseline: all farms using system 1 • System 2 becomes available, r% adopt, (1-r)% continue to use system 1 • Impact Indicators • Indicators calculated for each system and each stratum • Population indicators are a weighted average of indicators for farmers using each system in each stratum.
Implementing IA: Agricultural Systems Design • Farm Household • Income • Health & nutrition • Distribution & assets • Aquaculture system • productivity • costs • feed • water & waste management • pond construction • and maintenance • Crop system • productivity • costs (variable, fixed) • input use (fertilizers, other) • land allocation • soil & water management • Livestock system • productivity • costs • herd health • feed quantity & quality • manure management • Environmental processes • on-farm (soils) • off-farm (runoff, erosion, GHG, • pond effluent)
The Malawi Case Study: Integrated Agriculture-Aquaculture • population: southern Malawi • strata: 5 southern districts • systems: • system 1: maize, beans other subsistence crops • system 2L: system 1 with small ponds, low integration • system 2H: system 1 with larger ponds, irrigated vegetables, high integration • random survey of farms by strata and system Subsistence crops Aquaculture Irrigated vegetables
The Malawi Case Study • We will use the case study to show you the kinds of data we need to do impact assessment of aquaculture systems • At the same time, we will evaluate the data needed for your projects and design a plan to acquire them and implement IA Subsistence crops Aquaculture Irrigated vegetables
Exercise 1: Populations, Systems & Indicators • Define the populations and strata for your investigations (you may want to draw a map) • Develop a schematic diagram for the existing or baseline system (system 1). • Develop a schematic diagram for the system(s) with improved technologies (system 2). • Define the relevant indicators for your investigations.
Modeling Adoption Rates • Farmers choose practices to maximize expected returns • Farmers expect to receive v1 ($/ha/season) for system 1 • Farmers who adopt system 2 expect to earn v2 ($/ha/season) • The opportunity cost of changing from system 1 to system 2 is defined as ω = v1 – v2 • Note: ω < 0 means gain from adoption of system 2 • ω > 0 means loss from adoption of system 2 • Returns vary spatially, so opportunity cost varies spatially, and is described with the distribution (ω)
(ω) Construct spatial distribution of opportunity cost ω > 0 (non-adopters) ω < 0 (adopters)
Opportunity cost and adoption rate: 1 farm ω =20, r = 0 r (%) () 0 100
Opportunity cost and adoption rate: 1 farm r (%) () 0 100 ω =-10, r = 1
Opportunity cost and adoption rate: 2 farms () Rate 0 100
Opportunity cost and adoption rate: 3 farms () Rate 0 100
Opportunity cost and adoption rate: Many farms () Rate 0 100
Derivation of adoption rate from spatial distribution of opportunity cost 0 < ω r () 100 ω < 0 r (0)
Varying the Adoption Rate • We often want to use the model to see the effects of a range of different adoption rates • E.g., low adoption rates may occur because farmers cannot get access to the technology or lack resources to invest • E.g., high adoption rates may occur because farmers are required by government regulations to use a technology that reduces pollution • We assume farmers choose system 2 if it is more profitable than system 1 • As we “force” the model to lower or higher adoption rates, average farm income in the population will be lower than at the profit-maximizing adoption rate.
Varying the Adoption Rate (cont.) • To simulate the effects of farmers using different adoption rates, the model can simulate the effect of giving all farmers an incentive payment or penalty (PAY) for using system 2. This payment is used to calculate the adoption rate, but it is not included in the calculation of farm income. • With an incentive payment, famers use system 2 if: • v1< v2 + PAY • or if v1 – v2 < PAY • or if ω < PAY • So when PAY = 0 we get the adoption rate that occurs without any incentive payment or penalty. This is the adoption rate that gives the highest average farm income in the population.
, Pay Adoption rate with incentive payment (Pay) ω > Pay0 PAY0 0 < ω < Pay0 Adoption Rate () 100 ω < 0 Adoption rate with Pay0 > 0
, Pay Using PAY to simulate effects of different adoption rates Adoptionrates with Pay <0 PAY > 0 Adoption Rate () 100 PAY < 0 Adoption rates with Pay >0
Parameters of the Distribution of Opportunity Cost • Farms are heterogeneous so = v1– v2varies across farms. • We use the mean and variance of in the MD model. • Mean: E () = E (v1) – E (v2) ($/ha) • Suppose system 1 has one activity, then: • E (v1) = P11 Y11 – C11 – f11 • P11 = price of output for activity ($/Y/time) • Y11 = yield of activity 1 (Y/ha/time) • C11 = variable cost of activity 1 ($/ha/time) • f11 = fixed cost of activity 1 ($/ha/time) • Note: subscripts are system, activity
System 2 with 1 activity: • E (v2) = P21 Y21 – C21 – FC21 • P21 = price of product of activity 1, system 2 • Y21 = output of activity 1, system 2 • C21 = variable cost of activity 1, system 2 • f21 = fixed cost of activity 1, system 2 • Note: subscripts are system, activity
Variance of : • i standard deviation of returns, system i • ik covariance of returns, system i and k • ρ12 12/12 • 2 E( - E())2 = E({v1 - E(v1)} – {v2 - E(v2)})2 • = 12 + 22 – 212 • = 12 + 22 – 212ρ12
Multiple Activities in a System • Suppose system 1 has 2 crop activities • Each activity k uses a share W1k of the land • E.g., activity 1 = maize, activity 2 = beans • farm size = 2 ha, maize = 1.5 ha, beans = 0.5 ha • Then W11 = 1.5/2 = 0.75, W12 = 0.5/2 = 0.25 • Now vik = PikYik – Cik – fik,for i,k = 1,2 • E (v1) = W11v11 + W12v12 • E (v2) = W21v21 + W22v22 • Remember: first subscript = system, second subscript = activity
Data: Malawi case study • Surveys • Random sample of farms without IAA and with IAA in each stratum (district) • Areas, farm size, household size, income, health, nutrition… • Other economic data from secondary sources • Crop yields, prices, costs of production • Yield variances • Land use • Environmental and social data, as needed: • Pond effluent & water quantity, quality data • Soil, climate data for crop system • Estimate crop yields using crop simulation models? • Estimate change in soil nutrients or soil carbon? • Nutrition: e.g., protein consumption
Exercise 2: Data Preparation • Open Database\malawi_tables.doc. Review the data tables for Malawi, note the way the data are organized by strata. • Open Database\MW_DATA_L.xls. This is the data template for the model. This file is set up with data to analyze adoption of System 2L, the aquaculture system with low integration. • Look at the Variable Description sheet in the data template, and then the other sheets with highlighted variables. Identify how data from the tables have been put into the sheets in the template. • As you review the data template, start preparing a list of data needed for the systems you identified in Exercise 1 for your investigations. Identify which variables are available, which ones may need to be obtained from a survey or from secondary sources.
Exercise 3: Run the Model for Adoption of the Low-Integration System (System 2L) • Open the model Econmod\TOA_MD6_AF.xls. • Following the directions given, load the data Database\MW_DATA_L.xls and run the model. • Examine the model output in the sheets and graphs. • Interpret the results, using the variable descriptions in the data template. • What is the predicted adoption rate for System 2L? • What is the poverty rate with zero adoption? How much is poverty reduced by adoption of System 2L? • Can you explain what happens to net returns per farm as the adoption rate varies?
Exercise 4: Set up a model for adoption of System 2H by farms using System 1 • Find the data in the data tables for system 2H. • Open the data template for system 2L. Put the data for system 2H into the sheets where system 2 data belong. • Run the model. • Compare the results for System 2L and 2H. Can you explain the differences you see in adoption rates, poverty and nutrition outcomes?
Exercise 5: Sensitivity analysis to the parameter RHO12 • Explain what RHO12 represents in the model. • What happens when RHO12 = 1? (Hint: review the formula for the variance of ω) • Run the model for adoption of System 2H with different values of RHO12 • Can you explain why the adoption rate changes as you change RHO12? • Would you say the model is “sensitive” to this parameter?
Exercise 6: Set up a model for adoption of System 2H by farms using System 2L Hint: you need data from the two data templates you have already used. Compare the results from the three models you have now run: can you explain the differences?
Variance of opportunity cost and adoption rates • = 0 • r = 0 () r (%) 0 100 Note effect of variance on adoption rate