Download
1 / 30
300 likes | 429 Views
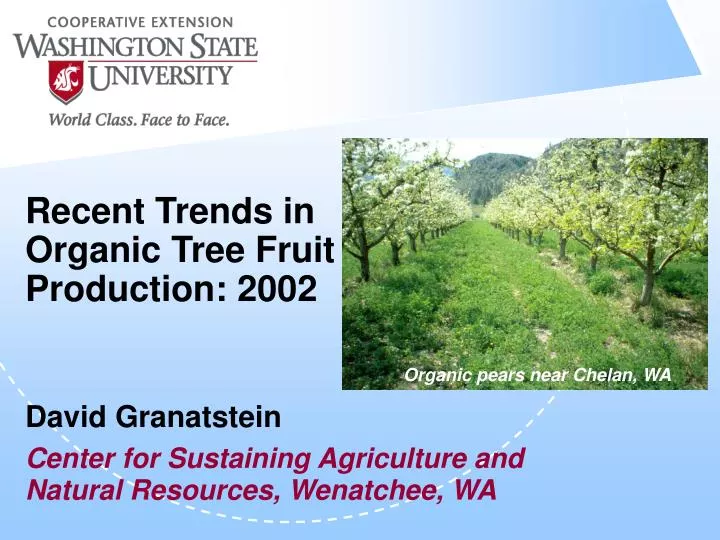
Recent Trends in Organic Tree Fruit Production: 2002. David Granatstein Center for Sustaining Agriculture and Natural Resources, Wenatchee, WA. Organic pears near Chelan, WA. Growth of Organic Food Sales. Projected $20 billion in sales by 2005. Source: Organic Trade Association.

E N D
Recent Trends in Organic Tree Fruit Production: 2002 David Granatstein Center for Sustaining Agriculture and Natural Resources, Wenatchee, WA Organic pears near Chelan, WA
Growth of Organic Food Sales Projected $20 billion in sales by 2005 Source: Organic Trade Association
Acreages of Main Organic Crops in WA 2002Cert.Trans. • Tree Fruit 10773 2186 • Grapes 1410 298 • Berries 380 114 • Hay 4280 329 • Pasture 3043 81 • Grains 4110 70 • Fallow 2368 88 • Herbs 1982 5 • Vegetables 9335 43 Total 39501 3381
The “Organic Divide” WESTEAST Certified Acres 5656 (18%) 25,312 (82%) Transition Acres 80 (2%) 3,904 (98%) # Growers 143 (34%) 276 (66%) Ave. Acres/Grower 39.5 91.7
Washington Organic Tree Fruit Acreage* by County - 2001 * certified + transition
Estimated World Organic Apple and Pear Acreage - 2001 Certified Acres ApplePear U.S. 17,572 2,798 Europe 8,675 3,665 New Zealand 2,873 163 South America 1,385 932 Canada 800 60 Total 31,005 7,618 China, Turkey ??
U.S. Organic Tree Fruit Acreage - 2001 Apple PearCherryAll fruit WA 6540 1308 303 8436 CA 4529 842 179 8662 AZ 2800 -- 30 2830 CO 1535 100 133 1923 ID 503 -- -- 506 OR 350 500 25 1180 Others 1015 48 57 1198 Total US 17,272 2798 727 23,835
Organic Tree Fruit Acreage in WA - 2002 Cert.Trans.Total Apples 8075 1786 9861 Pears 1771 192 1963 Cherries 501 184 685 Apricots 90 12 102 Peaches 195 4 199 Nectarines 78 3 81 Plums 46 3 49 Other 17 2 19 Total 10,773 2,186 12,959
Organic Apple Acreage in Washington State Pheromone MD Alar
Organic Orchard Acreage as a Percent of Total Washington Orchards ApplePear 1996 0.68 1.49 1997 0.96 1.68 1998 1.05 1.84 1999 1.36 1.87 2000 2.48 2.54 2001 3.90 5.27 2002 4.81 7.14 2002 (C+T) 5.87 7.92 Based on 2001 USDA-National Agricultural Statistics for bearing acreage
Price Trends Org Org Org Conv Conv Red Delicious Conv Golden Delicious
Price Trends Org Org Conv Conv Granny Smith Braeburn
Price Trends Org Fuji Conv Gala
Price Trends Org Conv Bartlett D’Anjou
Price Trends Bosc
Challenges • NOP implementation • Lack of international harmonization – export barriers • Retail pricing – U.S. vs. Switzerland
Estimated Food Sector Share of the Apple Price Grower Packer Trucker Retail profit Organic Fuji 1.09 .45 .20 .15 .10 Broker $1.99/lb Grower Packer Trucker Retail profit Fuji .225 .175 .11 .44 $0.95/lb Retail Markup Fuji 86% Org. Fuji 120% Farm Share of Retail Price Fuji 23% Org. Fuji 23%
Opportunities for Organic Tree Fruit • Food quality differences – taste, storability, nutrition, nutraceuticals • Combine “organic” with other ecolabels • US Farm Bill – Conservation Security Program payments for stewardship