Download
1 / 45
450 likes | 555 Views
Explore links between human behaviors, water quality, and ecosystem services in the Maumee watershed and Lake Erie. Study impact of climate change on upstream practices and downstream ecosystems.

E N D
Co-Evolution of Upstream Human Behavior and Downstream Ecosystem Services in a Changing Climate Jay Martin, FABE Brian Roe, AEDE Elena Irwin, AEDE Eric Toman, SENR Stuart Ludsin, EEOB Robyn Wilson, SENR Erik Nisbet, Comm Carlo De Marchi, CWRU Funded by: NSF-Combined Human and Natural Systems 8/11-12/15, $1.5M
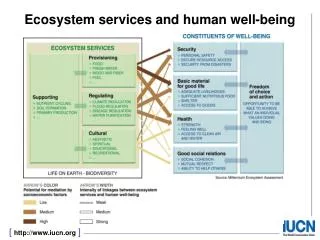
Introduction • Interdisciplinary project focused on human behaviors, water quality, and ecosystem services • Behaviors: Land use (i.e. Ag.) practices • Water quality: local and downstream • Ecosystem services: drinking water, fish recruitment, amenity-based recreation, among others • Two overall objectives • 1) model the links between ecological conditions, public attitudes, policies, and land use practices • 2) integrate biophysical models with behavioral models to predict water quality under alternative future scenarios, including climate change • Study site: Maumee watershed and western Lake Erie
Problem description • Non-point source runoff from upstream agricultural production is impairing downstream coastal ecosystems and ecosystem services • Great Lakes, Chesapeake Bay, northern Gulf of Mexico • Projected to worsen with continued climate change • More intense rains transport more nutrients and sediments downstream • Expected consequences • Reduced clarity • Increased harmful algal blooms • Loss of high-valued fish stocks
Problem description • Best management practices reduce sediment production • Conservation tillage, controlled drainage, riparian buffers • Limited adoption • Largely voluntary • Ag decisions occurring within context of changing climate • Central question: • Can changes in upstream public attitudes, policies, and farmer behavior offset the anticipated negative impacts of climate change on downstream ecosystem services?
Study area • The Maumee River and watershed • 25 counties in 3 states • Long-term, observed linkages between human behaviors and downstream conditions • 1970’s: Lake Erie declared dead • 1970 – 90’s: P-abatement programs led to rehabilitation • Recently: P increasing due to agricultural runoff • Maumee R.: main driver of P inputs to western Lake Erie
Impacts of Climate Change on Public Health in the Great Lakes due to Harmful Algae Blooms Jay Martin, FABE Stuart Ludsin, EEOB Tim Buckley CPH Carlo De Marchi, CWRU Funded by: Sea Grant (We Hope!) 2/13-1/15, $189,500
Objectives • Integrate an existing watershed hydrology model with relationships linking Microcystis to river discharge parameters to predict the impacts of climate change and land use on the concentration of Microcystis in Maumee Bay. • Develop empirical models linking the concentrations of Microcystis predicted in Objective 1 to public exposure and health risk. • Integrate results from Objectives 1 and 2 to forecast how climate and land use change will affect Microcystis and microcystin concentrations and public health in Maumee Bay.
Study Area • Great Lakes basin: Mean temperature increases of 0.7°C from 1895 – 1999 (nearly double the national rate) • Lake Erie’s basin: 0.23° from 1977 – 2007 • Rain events: increase in events above 2.5cm of 2.8 to 5.3 days/year • Trends projected to continue • Majority of P inputs to Lake Erie during precipitation driven river discharge events
Obj. 1: Regional Policy Assessment • Model the influence of environmental, social, and individual-level factors on public attitudes and the adoption of agricultural policies at the local and state levels.
Obj 1: Regional Policy Assessment • Downstream ecological conditions in the Maumee W-shed are influenced by • Upstream agricultural practices (Matisoff and Ciborowski 2005) • Environmental context and climatic influence (Mortsch et al. 2000, OEPA 2010) • Agricultural management decisions influenced by multiple factors, including • Agricultural policies (Secchi et al. 2008) • Normative influences (Roy et al. 2010) • Farmer goals/objectives and underlying variables (Ferry and Wilson 2010; examined in Objective 2)
Hypotheses • Public attitudes about downstream ecological conditions and policy approaches to mitigating upstream agricultural practices vary across the watershed based on contextual factors • e.g., distance from lake, population density, local importance of agriculture, information environment • These contextual factors are mediated by individual processes of opinion-formation (e.g., knowledge deficits, risk perceptions, heuristics) • Policy and management responses are influenced by external demands and internal variables
Objectives 2 and 3 Objective 4 Objective 1
Obj. 1-Approach: Three Stages • Stage 1: Analysis of the decision-making environment • Stage 2: Assessment of stakeholder engagement, attitudes, and influencing variables • Stage 3: Specification of multi-level, regional policy model
Obj. 1, Stage 1 • Systems theory of policy development • Public policy: response to external demands regarding allocation of values (Dye 1998) • Demands may include public attitudes, lobbying by interest groups, contextual conditions (e.g., water quality, economic conditions, etc.) • Policy makers weigh demands in internal decision process (influenced by psychological variables) • Policies result from interaction between external and internal variables
Models of public policy-Systems model • Policy: value allocations of political system based on external demands and support Decision-making Environment The Political System Demands Inputs Outputs Decisions and Actions Support
Obj.1, Stage 1-Methods • Focus groups with key stakeholders (8) • 2 x 2 design (community type, distance from lake) • 8 prior to and 8 following workshop • Watershed policy workshop • Ecological experts within region • Fuzzy cognitive model qualitative model of Maumee w-shed and potential management levers • In-depth interviews with policy/decision-makers • Elected officials and management personnel
Obj.1, Stage 2 • Quantitative assessment of stakeholder engagement and attitudes • Attitudes influenced by contextual (human and natural) and individual characteristics (Abroms and Maibach 2008) • Examined variables based on theory • Deficit Model (Miller et al. 1997)-role of scientific knowledge • Risk Information Seeking and Processing model (Griffin et al. 1999)-risk perceptions, information seeking, norms • Heuristic Model (Nisbet 2005)-use of cues to form opinions
Obj. 1, Stage 2-Methods • Quantitative mail survey • Maumee Watershed-389 primary sampling units (based on census tracts) • Multi-stage sampling design • 1) Stratified random sample select 45 census tracts based on population density and distance from lake • 2) Random selection of 120 households per census tract • Goal: minimum of 1350 completed surveys
Obj. 1, Stage 3 • Multi-level regional policy model that predicts • The influence of individual factors on policy attitudes given levels of contextual factors • How individual factors and attitudes depend on the human context and/or ecosystem conditions • How the influence of contextual factors on attitudes is mediated by individual factors
Obj. 1, Stage 3-Methods • Specify a hierarchal linear model with three levels of analysis (Raudenbush and Bryk 2002) • Examine influences on support for agriculture policies • Individual (n=1350): include measures of beliefs, risk perceptions, knowledge • Census-tract (n=45): evaluate interactions between ecological, spatial, and human-level factors with individual-level variables • County (n = 25): primary contextual unit for policy/management decisions
Obj. 1, Expected results • Develop a model that predicts the influence of ecological conditions on attitudes toward policies and practices to manage future conditions • Improved understanding of the complex, multi-level relationships between the ecological and human variables that influence policy attitudes and adoption • Inform development of policy influences on farmer decision-making (obj.’s 2 and 3)
Obj. 2: Farmer Decision Making Model • Develop a farmer d-m model to explain observed land use and management choices and predict changes in these decisions given public attitudes and support for policies that seek to improve downstream ecosystem services.
Obj. 2: Farmer Decision Making Model • The economics of farm management is well understood but economic models do not provide a comprehensive model of farmer behavior (Liu et al. 1974) • Need to incorporate alternative farming goals into determining farmer decision making rules • Specific form of the decision rule dependent on individual farmer characteristics, farm-level attributes, and regional conditions/policies.
Obj. 2-Hypotheses • Distance from Lake Erie influences the importance of environmental stewardship relative to profit maximization. • Individual characteristics (age, education, risk attitudes) have a greater influence than distance on decision making rules. • Farmer attitudes and beliefs toward risk, profit, the environment, etc. are mediated more by other farmers than by public attitudes toward ecosystem services.
Obj. 2-Approach: 3 Stages • Stage 1: Conduct farmer survey to identify behavioral and contextual mechanisms underlying d-m rules • Stage 2: Model individual utility and d-m rules • Stage 3: Predict farmer responses to hypothetical policy changes
Obj. 2-Methods • Stage 1: Farmer Survey • Focus groups to ID key variables • Self-administered mail survey • 2500 commercial farm operators randomly selected from 24 county region, stratified by size and type • Stage 2: Modeling Utility • Estimated based on survey data • Stage 3: Predicting Policy Response • Conjoint analysis based on Obj 1 policy mechanisms • E.g. Given X mechanism, how does farmer utility and resulting d-m change?
Obj. 2-Expected results • Development of a farmer d-m model that predicts utility and land use/mgmt based on multiple individual and contextual attributes. • Ability to predict farmer responses to policies and changing ecological conditions due to climate change. • Measurement of behavioral and d-m rules that can be predicted across the landscape based on census level data (location, land use, tillage practice, etc)
Objective 3: Spatial behavioral model • Develop a spatial behavioral model based on the farmer decision making model developed in obj. 2 that predicts agricultural land use and management outcomes across the watershed under baseline and alternative future scenarios.
Yellow = Corn Green = Soybeans Dark Red = Wheat Source: Kevin Czajkowski, Department of Geography and Planning, University of Toledo 2007 Land Cover Maumee Watershed Orange = Hay/Pasture/Grass Dark Green = Forest Blue = Open Water
Red = Traditional tillage (residue plowed under) Orange = Mulch tillage (some residue left) Yellow = No Till (fall residue left undisturbed) Source: Kevin Czajkowski, Department of Geography and Planning, University of Toledo 2006 Tillage Practices Maumee Watershed Green= Forest Blue = Water Black = Unclassified (urban areas)
Problem: Many models focus on the pattern and not the underlying process • Process-based model = structural model that generates predictions of outcomes based on individual behavior (economic, risk, values, attitudes, motivations) and interactions (market and non-market) • Pattern-based model = model of observed outcomes that estimate pattern-based correlations in the data (e.g., distance to road or urban center, surrounding land use, soil and other physical features) • Why is understanding the underlying processes important? • The effectiveness of a policy depends on the behavioral responses of people to the policy need to understand behavioral processes • Simulating dynamics or non-marginal changes in a constraint (e.g., a policy) requires structural modeling, as much as possible
Obj. 3-Hypotheses • Changes to existing land conservation policies (e.g., CRP) and the introduction of hypothetical policies (e.g., payments for buffer strips), will cause a reduction in land use at the extensive margin, but an increase in land management at the intensive margin • Farmer responses will vary with behavioral variables, including risk attitudes and motivations (e.g., environmental stewardship, economic profits, family succession) • Expected outcome: The spatial behavioral model that can account for heterogeneous farmer responses will outperform the trend model in its predictive accuracy
Obj. 3-Methods • The challenge: Predicting land use and management choices across the watershed in the absence of a full census of farm and farmer data across the watershed • We observe land cover, use and tillage by pixel; some farm and farmer characteristics at the Census tract level; behavioral characteristics are unobserved • Modeling approach • Use the decision-making rules estimated in Obj 2, observed farm and farmer characteristics and observed land use/management outcomes to “back out” estimated behavioral variables at Census tract level • Use calibrated spatial behavioral model to predict out-of-sample land use and management outcomes across the watershed for alternative policy scenarios as determined in Obj 1 • Compare to “trend” model in which behavior is not accounted
Obj. 3-Expected Results • Forecast agricultural land outcomes across the watershed based on behavioral and other individual attributes • Evaluate a much broader range of potential policies in terms of their predicted impacts on farmer behavior, land use and management decisions and the condition of the downstream ecosystem
Obj. 4-Biophysical model • Develop a biophysical model of the Maumee watershed and western Lake Erie to predict downstream ecosystem change as a function of climate and agricultural land management.
Obj. 4-Methods • Historical climate data will be used to drive an extant Maumee watershed/hydrology model. • The model will simulate the transport of sediments and P downstream in response to land use change in the watershed predicted in obj. 3. • Outputs will include daily inputs of water, sediments, and P into western Lake Erie, which will serve as inputs into our statistical models to predict water clarity, harmful algal blooms, and fish stocks.
Obj. 4-Hypothesis • ‘Hot spots’ identified in the Maumee watershed, which disproportionately contribute inputs of P and sediments the downstream ecosystem, will more closely align to land use/management practices than with geographical distance from the lake.
Obj. 4-Expected Results • The biophysical model will predict the role of climate and behaviorally-driven spatial land use change on the downstream ecosystems • Identify critical areas (“hot spots”) in the watershed that have (or will have) a disproportionate effect on the downstream ecosystems
Obj. 5-Model integration • Conduct spatially-explicit computer simulations, using regional climate models (Fig. 2) to drive our coupled models of public policy (obj. 1), farmer behavior (obj. 2), land management change (obj. 3), and the biophysical system (obj. 4) to determine if changes in human behavior across the watershed can offset expected impacts of climate change on downstream ecosystem services.
Obj. 5-Hypothesis • Changing human attitudes and behaviors can mitigate downstream climate change impacts on western Lake Erie
Obj. 5-Expected results • Explicit modeling of the behavioral and biophysical trade-offs induced by climate change will aid local resource managers and policy makers in identifying successful methods to offset expected climate impacts.