Download
1 / 4
40 likes | 231 Views
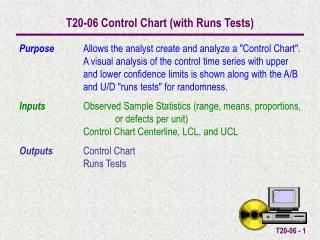
T20-05 Forecast Control Limit Calculations. Purpose Allows the analyst to calculate the “Forecast Control Chart” 3-sigma control limits based on the MSE.. Inputs MSE Outputs Forecast Control Chart LCL & UCL. Forecast Control Chart.

E N D
T20-05 Forecast Control Limit Calculations Purpose Allows the analyst to calculate the “Forecast Control Chart” 3-sigma control limits based on the MSE.. Inputs MSE Outputs Forecast Control Chart LCL & UCL
Forecast Control Chart The Forecast Control Chart is used to monitor the forecast accuracy of a forecasting methodology. The Forecast Control Chart formula for the centerline, LCL and UCL are
Example Calculate the LCL and UCL for a forecast control chart when the MSE is 7.39.
The LCL, UCL are automatically calculated Input the MSE in the light green cell