Download
1 / 17
170 likes | 186 Views
This study presents the trade model within Transtools3, focusing on estimating transport chain choice models and relative trade costs. The model incorporates gravity-based trade analysis and employs fixed effects and random effects models. The findings provide insights into the determinants of trade flows and can be used to assess the trade effects of changes in the European Union.

E N D
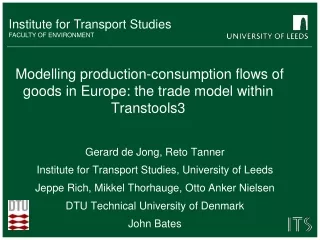
Modelling production-consumption flows of goods in Europe: the trade model within Transtools3 Gerard de Jong, Reto Tanner Institute for Transport Studies, University of Leeds Jeppe Rich, Mikkel Thorhauge, Otto Anker Nielsen DTU Technical University of Denmark John Bates
Contents • The Transtools3 freight transport model • Model specifications • Data • Estimation results and elasticities • Conclusions and further work
Position of the Transtools3 freight model • Transtools1 and 2 were EU-wide models for passenger and freight transport for the European Commission DG MOVE • A consortium led by DTU is now developing a new model for passenger and freight transport at the European scale for DG MOVE • These are all transport-network-based models (heavy; relatively detailed networks) • The Transtools3 freight transport model follows a different approach than before • Transtools3 zones are NUTS3 or subdivisions of those and the commodity classification is NST/R-1 • Add Presentation Title in Footer via ”Insert”; ”Header & Footer”
Structure of the overall Transtools3 freight transport model (follows ADA) • Add Presentation Title in Footer via ”Insert”; ”Header & Footer”
The trade model within Transtools3 • Focus in Transtools 3 was on estimating transport chain choice models on disaggregate data • We tried to keep trade model relatively simple and to base it on the limited amount of available data • No SCGE or I/O model, but a gravity-based trade model • But have to tackle a number of issues: • Relative costs • Many trade flows between countries are zero
From my lecture notes: freight transport distribution models
Gravity for trade: relative cost • Modern theoretical literature on gravity-based trade models: • trade between two countries is not simply determined by the absolute trade costs between the two countries, but by the relative trade cost (=the trade cost of country i from importer j relative to its overall trade cost for all the countries from which it imports). • In an empirical gravity model, this can be taken into account by • adding multilateral resistance terms. • However a simpler method is to use importer or exporter • fixedeffects • But then GDP of country i or j has no impact anymore • Or random effects model
Fixed effects model • Model with fixed effects at the level of destination countries j :
Random effects model • Model with random effects:
Countries with zero trade • In the data many country-country flows (by NST/R 1) are zero • Actually two decisions: • Whether to export to a country at all • How much trade if trade • Heckman model (two steps): • Discrete participation (selection) equation • Continuous demand equation
Heckman model • The demand equation is: • The selection equation is:
Data for estimation • Dependent variable: • PC matrices in tonnes by NUTS3 zones for 2010 from ETISplus project (‘synthetic’ or ‘modelled’) • Aggregation to country level (‘observed’) • We tried both in estimation, but prefer latter, since this is based on observed data, not a synthetic split. • Independent variables: • GDP and population from World Bank -> GDP and GDP/capita • Crow-fly distance (will be replaced by generalised costs) -> distance splines • Dummy variables on barriers to trade, trade blocks, etc.: • EU or EFTA member • Euro as currency • Neighbours • Same language
Estimations • By NST/R-1 commodity: 10 submodels • For NUTS3 zones andforcountries • Linearand double logarithmic • Standard absolute costs, fixedeffects (2x), random effects • Withand without participationequation (Heckman) • We prefer: • Random effectsmodel estimated on country data: • Observed data • Account forrelativecosts • Full effect of GDP changes • Deleting zero flows is acceptable (Lindersand de Groot, 2006; andour data)
Random effects model estimation results for agricultural products (n=6388) • Add Presentation Title in Footer via ”Insert”; ”Header & Footer”
GDP elasticities of trade flows in tonnes from random effects model • Add Presentation Title in Footer via ”Insert”; ”Header & Footer”
Implementation of trade model within Transtools3 • In the application of the trade model, we only use the GDP and GDP per capita elasticities • We assume that distances and the dummies do not change • The model however can also be used however to calculate the trade effects of changes in the composition of the European Union, such as Brexit, or the EURO zone • The trade model then reads in the 2010 base PC matrix (from ETIS+) and income and population changes per zone. • Add Presentation Title in Footer via ”Insert”; ”Header & Footer”
Conclusions and further work • In Transtools3, future year PC matrices from the trade model are combined with the disaggregate transport chain choice model. • We estimated fixed effects, random effects and Heckman models on zonal and on country data • We prefer the random effects model on country data • This uses distance between countries • We are working on replacing distance by a logsum variable from the transport chain choice model • so that there will also be an influence of transport costs on the pattern of PC flows • Add Presentation Title in Footer via ”Insert”; ”Header & Footer”