Download
1 / 4
220 likes | 668 Views
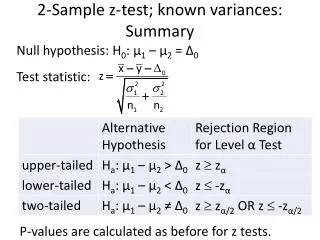
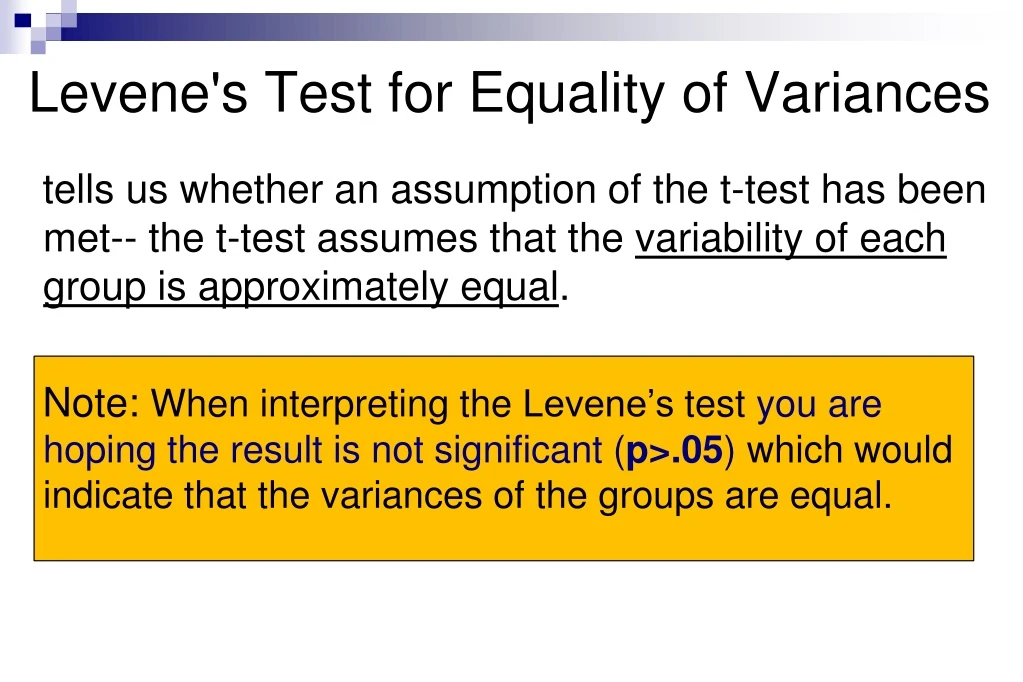
Levene's Test for Equality of Variances. tells us whether an assumption of the t-test has been met-- the t-test assumes that the variability of each group is approximately equal .

E N D
Levene's Test for Equality of Variances tells us whether an assumption of the t-test has been met-- the t-test assumes that the variability of each group is approximately equal. Note: When interpreting the Levene’s test you are hoping the result is not significant (p>.05) which would indicate that the variances of the groups are equal.
If this value is less than or equal to your α level for the test (usually .05), then you can reject the null hypothesis that the variability of the two groups is equal, implying that the variances are unequal. • If the p value is less than or equal to the α level, then you should use the bottom row of the output (the row labeled "Equal variances not assumed.") • If the p value is greater than your α level, then you should use the middle row of the output (the row labeled "Equal variances assumed.") • In this example, .203 is larger than α of .05, so we will assume that the variances are equal and we will use the middle row of the output.
Levene’s test=.719 • OUTPUT—What to look for: • 1.group statistics. We see that the mean SDAT score for the experimental group is 95.00 (SD 12.43) and for the control group the mean is105.00 (SD 11.78). • 2. Levene’s test result. The result is .719 which is not significant because p>.05 so we can assume that there is no significant difference between the variances of the two groups. • 3.T statistic which is a -1.84, disregard the negative sign in front of the value. The negative sign is there because of the way the variables were entered into the computer program. • 4.The df (degrees of freedom) are 18. This is calculated by subtracting one degree of freedom from the n of each group (experimental group 10-1 = 9, control 10-1 = 9) and then adding the result (9 + 9 = 18). • Finally, with alpha set at .05, we conclude that p=.081 is not statistically significant (p>.05) and therefore that there is not a statistically significant difference between the mean SDAT scores of the experimental and control group.
The above table contains statistics for a paired sample. There are 12 patients in the sample and based on these results all 12 patients participated at both time periods. • The mean temperature before administration of aspirin was 102.20 (SD 0.80) and the mean temperature 1 hour after aspirin was 100.45 (SD 0.56). • The Levene’s test is not necessary here because we are measuring the same people at two different times so the variances between the groups would be equal since they are coming from the same population. • Next look at the value of the paired samples test, t=6.98, df=11, p=.000 and determine that the p-value is significant since the actual probability of this result p<.001 that is <.05. • Thus, the null hypothesis is rejected and the research hypothesis is supported. Therefore, we conclude that there is a statistically significant difference between mean temperatures taken before and one hour after taking aspirin.