Download

1 / 27
330 likes | 725 Views
Sales Variances. Variance information useful to the Sales Force ACCT 7320, Fall 2010. Summary of Variances. Static-Budget Variance (difference between target and actual income). Level 1 (Horngren terminology). Level 2. Flexible-Budget Variance (difference between actual and the

E N D
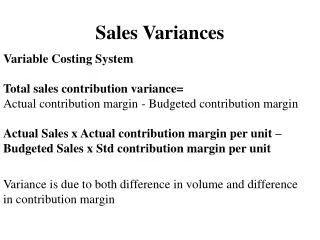
Sales Variances Variance information useful to the Sales Force ACCT 7320, Fall 2010
Summary of Variances Static-Budget Variance (difference between target and actual income) Level 1 (Horngren terminology) Level 2 Flexible-Budget Variance (difference between actual and the budget adjusted for level of sales activity) Sales-Volume Variance What is accounted for by the difference in sales level? DM, DL, OH, etc.
Analyzing Sales Variances • Variations in Sales Volume explain an important part of our total budget variance • Why did the Sales Volume Variance occur? • Quantity reasons • Mix-of-products reasons • Why did the Sales Quantity change? • Market size may have changed overall • Our share of the total market may have changed
Summary of Sales Variances Level 2 Sales-Volume Variance Level 3 Sales-Mix Variance (How much accounted for by the change in product mix? Sales-Quantity Variance (How much accounted for by the change in total number of “units” sold?
Summary of Variances Level 3 Sales-Quantity Variance Level 4 Market-Share Variance How much of the quantity variance is explained by loss/gain of market share? Market-Size Variance How much of the quantity variance is explained by loss/gain of total market size?
Budgeted Prices & Variable Costs Assume the English Language Institute sells Three Software Products: Product:GrammarTranslationComposition Selling price per unit $259 $87 $185 Variable cost 189 50 95 CM per unit $ 70 $37 $ 90
Budgeted Sales in Units and $ Product Grammar Translation Composition Cont. margin $70 $37 $90 × Units 3,185 980 735 = Total $222,950 $36,260 $66,150 Unit sales mix 65% 20% 15% Total budgeted contribution margin = $325,360
Actual Prices, VC, and CM The following are the actual results for 2008. Product Grammar Translation Composition Selling $/unit $255 $85 $185 Variable cost 180 45 95 Cont. margin per unit $ 75 $40 $ 90
Actual Unit Mix and Total CM Product Grammar Translation Composition Cont. margin $75 $40 $90 × Units 2,880 990 630 = Total $216,000 $39,600 $56,700 Sales mix 64% 22% 14% Total actual contribution margin = $312,300
Static-Budget Variances From Slide 6 Static- Static- Actual budget budget Productresultsamountvariance Grammar $216,000 $222,950 $ 6,950 U Translation 39,600 36,260 3,340 F Composition 56,700 66,150 9,450 U Total $312,300 $325,360 $13,060 U
Flexible-Budget BudgetedActual contribution unit Flexible Productmargin/unitvolumebudget Grammar $70 2,880 $201,600 Translation $37 990 $ 36,630 Composition $90 630 $ 56,700 This is what should have occurred given our level of sales. A fair benchmark for the Production/operations people!
Flexible-Budget Variance Flexible- Flexible- Actual budget budget Productresultsamountvariance Grammar $216,000 $201,600 $14,400 F Translation $39,600 $ 36,630 $ 2,970 F Composition $56,700 $ 56,700 0 Total flexible-budget variance $17,370 F
Recall Overview Static-Budget Variance $13,060 U Flexible-Budget Variance $17,370 F Sales-Volume Variance $30,430 U
Sales-Volume VarianceCalculation emphasizing Diff. in Unit Volumes Budgeted contribution Product (Actual – Budget)margin Grammar (2,880 – 3,185) × $70 = $21,350 U Translation (990 – 980) × $37 = 370 F Composition (630 – 735) × $90 = 9,450 U Total sales-volume variance $30,430 U
Reasons for Sales Volume Variance • If only one product, it’s simple: • (Actual Units-Budgeted Units)*Budg. CM/unit • With multiple products, 2 reasons: • The mix of products could change • The overall number of units sold could change • These are computed as impact on CM from: • Sales Mix • Sales Quantity
Sales-Mix Variance Sales-mix variance = Actual units of all products sold × Change in mix: (Actual sales % – Budgeted %) × Budgeted contribution margin per unit Computed for each product and total.
Sales-Mix Variance Grammar: 4,500(0.64 – 0.65) × $70 = $3,150 U Translation: 4,500(0.22 – 0.20) × $37 = $3,330 F Composition: 4,500(0.14 – 0.15) × $90 = $4,050 U Total sales-mix variance = $3,870 U
Sales-Quantity VarianceEffect on CM purely from quantity sold Sales-quantity variance = (Actual units of all products sold – Budgeted units of all products sold) × Budgeted sales-mix percentage × Budgeted contribution margin per unit • Rationale: • If overall sales increased… • and the sales mix had been as expected (budgeted)… • then contribution margin would have increased at the budget rate per unit.
Sales-Quantity Variance Grammar: (4,500 – 4,900) × 0.65 × $70 = $18,200 U Translation: (4,500 – 4,900) × 0.20 × $37 = $ 2,960 U Composition: (4,500 – 4,900) × 0.15 × $90 = $ 5,400 U Total sales-quantity variance = $26,560 U
Further Analyzing the Sales-Quantity Variance • Why did Sales Quantity Change? • market-share variance • Impact on CM due to change in share • market-size variance • Impact on CM due to change in overall market size
Market-Share Variance Example Assume that ELI assumed a 20% market share of a total industry sales forecast of 24,500 units of this type of software in the market. In 2008, reported actual industry sales were higher: 28,125 units. ELI’s actual market share? 4,500 ÷ 28,125 = 16%
Market-Share Variance Example To examine the impact of market share, we need the the budgeted average CM per unit. Budgeted number of units was 4,900. Budgeted total contribution margin was $325,360. $325,360 ÷ 4,900 = $66.40/unit
Market-Share Variance Example What is the market-share variance? Given the actual market size = Actual market size in units …if our share changed × Actual market share – Budgeted share …and our product mix is assumed constant, since the Market size variance measures that, then the effect will be proportional to the composite (average) CM. × Budgeted CM per composite unit for budgeted mix 28,125*(0.16 – 0.20) * $66.40 = $74,700 U Note: Not computed product-by-product, since the Sales Mix Variance already separated out that effect. We now are subdividing the Quantity variance.
Market-Size Variance = Actual market size in units – Budgeted market size If the market size changed …and we kept our budgeted market share (and of course our mix!)… × Budgeted market share × Budgeted CM per composite unit for budgeted mix …then the effect on our CM would be according to our composite unit CM for our mix. (28,125 – 24,500) × 0.20 × $66.40 = $48,140 F
Thus the Sales Quantity Variance is Explained Level 3 Sales-Quantity Variance $26,560 U Level 4 Market-Share Variance $74,700 U Market-Size Variance $48,140 F
Grand Overview Static-Budget Variance $13,060 U(Effect on Contribution Margin!) Flexible-Budget Variance $17,370 F Sales-Volume Variance: $30,430 U Sales-Mix Variance $3,870 U Sales-Quantity Variance $26,560 U Market-Share Variance $74,700 U Market-Size Variance $48,140 F