Space-Filling DOEs
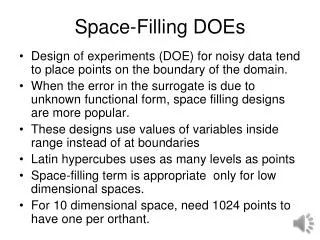
Space-Filling DOEs. Design of experiments (DOE) for noisy data tend to place points on the boundary of the domain. When the error in the surrogate is due to unknown functional form, space filling designs are more popular.

Space-Filling DOEs
E N D
Presentation Transcript
Space-Filling DOEs • Design of experiments (DOE) for noisy data tend to place points on the boundary of the domain. • When the error in the surrogate is due to unknown functional form, space filling designs are more popular. • These designs use values of variables inside range instead of at boundaries • Latin hypercubes uses as many levels as points • Space-filling term is appropriate only for low dimensional spaces. • For 10 dimensional space, need 1024 points to have one per orthant.
Monte Carlo sampling • Regular, grid-like DOE runs the risk of deceptively accurate fit, so randomness appeals. • Given a region in design space, we can assign a uniform distribution to the region and sample points to generate DOE. • It is likely, though, that some regions will be poorly sampled • In 5-dimensional space, with 32 sample points, what is the chance that all orthants will be occupied? • (31/32)(30/32)…(1/32)=1.8e-13.
Example of MC sampling • With 20 points there is evidence of both clamping and holes • The histogram of x1 (left) and x2 (above) are not that good either.
Latin Hypercube sampling • Each variable range divided into ny equal probability intervals. One point at each interval.
Latin Hypercube definition matrix • For n points with m variables: m by n matrix, with each column a permutation of 1,…,n • Examples • Points are better distributed for each variable, but can still have holes in m-dimensional space.
Improved LHS • Since some LHS designs are better than others, it is possible to try many permutations. What criterion to use for choice? • One popular criterion is minimum distance between points (maximize). Another is correlation between variables (minimize). • Matlablhsdesign uses by default 5 iterations to look for “best” design. • The blue circles were obtained with the minimum distance criterion. Correlation coefficient is -0.7. • The red crosses were obtained with correlation criterion, the coefficient is -0.055.
More iterations • With 5,000 iterations the two sets of designs improve. • The blue circles, maximizing minimum distance, still have a correlation coefficient of 0.236 compared to 0.042 for the red crosses. • With more iterations, maximizing the minimum distance also reduces the size of the holes better. • Note the large holes for the crosses around (0.45,0.75) and around the two left corners.
Reducing randomness further • We can reduce randomness further by putting the point at the center of the box. • Typical results are shown in the figure. • With 10 points, all will be at 0.05, 0.15, 0.25, and so on.
Empty space • In higher dimensions, the danger of large holes is greater. The figure is taken from paper by Goel et al. (details in notes). It compares LHS design on right with D-optimal design (optimal for noisy data). • Instead of maximizing minimum distance it seems that it would be better to minimize the volume of the largest void. Why don’t we do that? Figure 2. Illustration of the largest spherical empty space inside the three-dimensional design space (20 points): (a) D-optimal design and (b) LHS design.
Mixed designs • D-optimal designs may leave much space inside. • LHS designs may leave out the boundary and lead to large extrapolation errors. • It may be desirable to combine the two. • In low dimensional spaces you can add the vertices to LHS designs. • In higher dimensional spaces you can generate a larger LHS design and choose a D-optimal subset.
Problems • Write a routine to generate LHS designs and iterate using the two criteria and compare how well you do against lhsdesignfor 10 points in 2 dimensions. • Compare the maximum minimum distance obtained with 1,000 iterations of lhsdesign when you generate (n+1)(n+2) points in n dimensions (typical number used to fit a quadratic polynomial), for n=2, 4, 6.