Download
1 / 15
150 likes | 284 Views
NPS Inputs and EOS Targets. Developing EOS targets based on Nutrient Balance in the Chesapeake Bay Watershed Model. Nutrient Balance EOS Targets. Where do the targets come from? How Are Targets Distributed? (Why) Do they differ from Phase 4.3? Fate and transport of N and P Model Scale

E N D
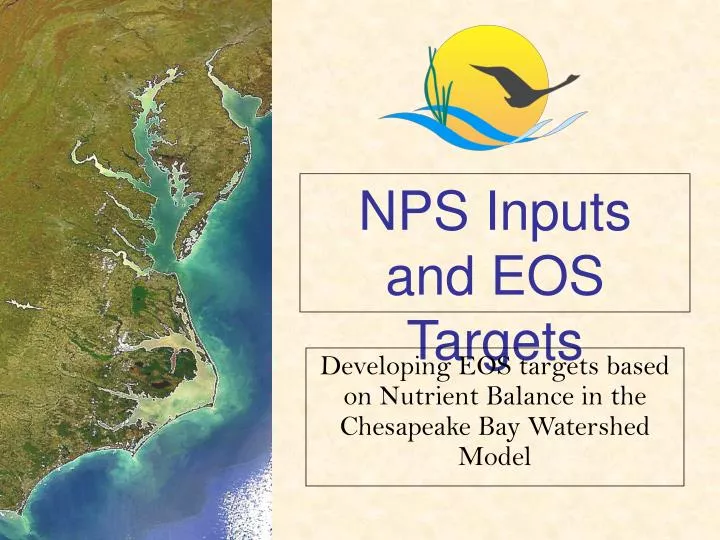
NPS Inputs and EOS Targets Developing EOS targets based on Nutrient Balance in the Chesapeake Bay Watershed Model
Nutrient Balance EOS Targets • Where do the targets come from? How Are • Targets Distributed? • (Why) Do they differ from Phase 4.3? • Fate and transport of N and P • Model Scale • Refined Land Uses • Newer Research Information • How Does This Affect Delivered Loads?
Where Do Targets Come From • Calculated Mass Balance of known inputs and outputs on land uses • Estimates of attenuation/delivery factors: • Literature Review Of In-Stream Concentrations assigned “back-stream” to likely upland sources • Addresses uncertainty in input/output estimates
Calculating Balance: Inputs/Outputs • Pervious Surfaces: • Inputs: Fertilizer, Manure, N-fixation, Atmospheric Deposition • Outputs: Crop Removal, de-nitrification, volatilization • Residual: Nitrogen (mobile) and Phosphorus (mobile and immobile) • The residual is that which may reach the stream
The Mass-Balance Approach • Determine all input types (I): • Atmospheric Deposition • Fertilizer Application (where applicable) • Manure Application (where applicable) • Legume Fixation (where applicable) • Determine all outputs (O): • Removal via harvest (potentially largest) • Volatilization/De-nitrification (low to high) • Sequestration in refractory organic matter (small) • Sequestration/Attenuation in lower order streams • Eligible for Losses to the watershed outlet (E)
Distributing EOS Targets • Based on distribution around Median Balance/Median In-stream Value From lit. review • Addresses uncertainty in the exact application rates, and attenuation of in-stream studies • EOS Target can NOT exceed Eligible Balance Ex: 45.1 Balance => 39.6 EOS Median Balance (LWM) Median In-Stream (LWM)
Impervious EOS – Mass Balance • Urban Impervious surfaces a little more difficult to characterize • Inputs: • Atmospheric Deposition (from Atmospheric model) • Miscellaneous • Direct Automobile Deposition (difficult to estimate) • Other Sources (animals, trash spillage, etc.) • Outputs: • Little to no attenuation of N and P is expected to occur on impervious surfaces • Outputs are known from urban studies, generally based on Event Mean Concentration (EMC) • Mass Balance: • E = m + A ; A = atmospheric, m = miscellaneous
Estimating M from NURP/NSDQ • Quantify the misc. on impervious surfaces from EMC • Assumptions: • Rainfall = runoff on impervious surface = 40” / ac-year • NURP/NSDQ Average EMC on highly impervious (>80%) 2.2 mg/L • This EMC represents mean value in watershed • EMCs already include any attenuation • Assume that “m” is constant, and the only variable is atmospheric • Acreage of impervious will be the greatest factor in loading • 12.74 lb-N/ac mean atmospheric deposition • m = EMC*Runoff - A • Calculations:
Change in TN Land Targets Between Phase 4.3 and Phase 5 • Started with similar targets to Phase 4.3 • Not enough Nitrogen to calibrate rivers • Analysis of targets vs export • We expect Nitrogen targets to be scale dependent. • Targets vs river loads • Independent studies
TN Comparison Modeled vs. Estimator (using P4.3 targets in P5) • Compared ESTIMATOR loads to upstream EOF targets
Resolution • Double Nitrogen targets from all land uses in non-coastal plain segments (eyeball estimate). • Phosphorus does not have a similar reduction mechanism and the targets are not scale-dependent
Nitrogen is Always Reduced in Rivers • Simulated river miles • Phase 4 – 2,479 • Phase 5 – 10,237 • National SPARROW model (1997): First order rate coefficients are scale dependent • Rivers < 1000 cfs = 0.38/day • Rivers between 1000 and 10000 cfs = .12/day • Rivers > 10000 cfs = 0.04/day • Considerable literature on denitrification • Many Seitzinger articles • Nitrogen budgets (e.g. Howarth)
Delivered: Phase 5 Versus Phase 4.3 • Phase 5 Nitrogen targets are roughly 2X that of Phase 4.3. • Phosphorus remains nearly the same. • Attenuation in lower (as compared to 4.3) order streams is now simulated, thus the EOS must approach the EOF • Consequently, Phase 5 N attenuation is much greater then 4.3 • Overall loads are similar, however, they will not be exactly the same since 1) the modeling period is different, 2) the model is more accurately calibrated
Phase 5 Versus 4.3 (delivered) Old School New School ~41% Attenuation ~17% Attenuation Similar Lesson: ~4.5 Million Lbs N