Download
1 / 1
10 likes | 93 Views
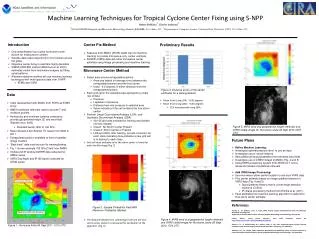
This study explores machine learning techniques for improving the accuracy of tropical cyclone center fixing using data from S-NPP. The research focuses on extracting features from AMSU and ATMS fields for center estimation, refining the estimates with AVHRR and VIIRS data through image processing and machine learning. Linear Discriminant Analysis (LDA) and Quadratic Discriminant Analysis (QDA) are utilized to classify grid cells and predict storm center probability. The preliminary results show promising improvements in center estimation accuracy. Future plans include refining machine learning models, investigating neural networks, and incorporating additional input parameters for better storm center estimates using multi-spectral data. The ultimate goal is to enhance objective center fixing in real-time for tropical cyclones.

E N D
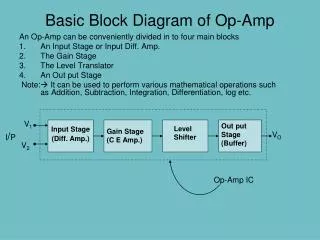
Machine Learning Techniques for Tropical Cyclone Center Fixing using S-NPP Robert DeMaria1, Charles Anderson2 1NOAA/NESDIS Regional and Mesoscale Meteorology Branch (RAMMB), Ft. Collins, CO2Department of Computer Science, Colorado State University (CSU), Ft. Collins, CO • Center Fix Method • Features from AMSU (ATMS) fields input to machine learning to provide microwave-only center estimate • AVHRR (VIIRS) data will refine microwave center estimate using image processing and machine learning • Microwave Center Method • Select area around extrapolated position • Area size based on average error between the extrapolated position and the true center • Used ~0.5 degrees in either direction from the extrapolated position • Each grid cell in the selected area represents a single row of data: • Pressure • Laplacian of pressure • Distance from min pressure in selected area • Value indicating if the cell contains the true storm center • Perform Linear Discriminant Analysis (LDA), and Quadratic Discriminant Analysis (QDA) • 40,125 grid cells selected for training and divided into two classes • Class1: No Storm Center Present • Class 2: Storm Center is Present • LDA and QDA, after training, provide a function for each class indicating how probable a new grid cell is to belong to each class • Grid cell most probable to be the storm center is found for each satellite image (Fig. 2) • The distance between the selected grid cell and the true storm center position is measured for verification of the algorithm (Fig. 3) • Introduction • Only west Atlantic has routine hurricane hunter aircraft for finding storm centers • Satellite data used subjectively to find centers across the globe • Objective center fixing in real-time highly desirable • CIMSS ARCHER method (Wimmers et al. 2010) estimates center from microwave imagery by fitting spiral patterns • Alternate objective method will use machine learning techniques with multi-spectral data from S-NPP • ATMS and VIIRS • Preliminary Results • Mean Error Using LDA: ~0.45 degrees • Mean Error Using QDA: ~0.40 degrees • 11% improvement using QDA Data Initial development with AMSU from POES as ATMS proxy AMSU statistical retrievals used to provide T and moisture profiles Hydrostatic and nonlinear balance constraints provide geopotential height (Z) and wind field (Bessho et al. 2006) Standard levels 1000 to 100 hPa Data includes 2,021 Atlantic TC cases from 2006 to 2011 Extrapolated position available at time of satellite image creation “Best track” data used as truth for training/testing Fig. 1 shows example 700 hPa Z field from AMSU Visible and IR window AVHRR data collected for AMSU cases VIIRS Day/Night and IR I05 bands collected for ATMS cases Figure 3. Distance errors of the center estimates for a testing dataset Figure 5. MIRS wind and geopotentialheight retrievals and VIIRS visible image for Hurricane Leslie 02 Sept 2012 1657 UTC • Future Plans • Refine Machine Learning: • Investigate optimal pressure level to use as input • Investigate use of neural network • Add additional input parameters from retrieved wind field • Investigate use of ATMS instead of AMSU (Fig. 4 and 5) • Using MIRS processing system from ATMS for T and q retrievals instead of statistical retrievals • Add VIIRS Image Processing: • Use microwave storm center location to sub-sect VIIRS data • Find center estimate based on image gradient features in VIIRS data (Fig. 4 and 5) • Spiral patterns fitted to Harris corner/edge detection locations (Collins) • IR image processing method from Ritchie et al. (2011) • Feed estimates into machine learning algorithm to determine final storm center estimate • References • Bessho, K. , M. DeMaria, and J. A. Knaff, 2006: Tropical Cyclone Wind Retrievals from the Advanced Microwave Sounding Unit: • Application to Surface Wind Analysis. Journal of Applied Meteorology and Climatology, 45, 399-415. • Collins, Robert. “Harris Corner Detector.” Penn State University. Lecture 06. http://www.cse.psu.edu/~rcollins/CSE486/lecture06.pdf • Ritchie, E. A. , G. Valliere-Kelley, M. F. Piñeros, and J. S. Tyo, 2011: Improved tropical cyclone intensity estimation using infrared imagery and best track data. Wea. Forecasting, 27, 1264-1277. • Wimmers, A.J., C.S. Velden, 2010: Objectively Determining the Rotational Center of Tropical Cyclones in Passive Microwave Satellite Imagery. Journal of Applied Meteorology and Climatology , 49, 2013-2034. Figure 2. Sample Probability Field With Maximum Probability Marked Figure 4. MIRS wind and geopotential height retrievals and VIIRS visible image for Hurricane Leslie 09 Sept 2012 1723 UTC Figure 1. Hurricane Katia 04 Sept 2011 1210 UTC