Download
1 / 13
150 likes | 404 Views
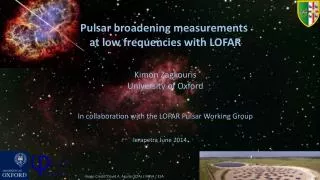
Pulsar broadening measurements at low frequencies with LOFAR. Kimon Zagkouris University of Oxford. In collaboration with the LOFAR Pulsar Working Group. Ierapetra June 2014. Image Credit : David A. Aguilar ( CfA ) / NASA / ESA. Pulsar Scattering.

E N D
Pulsar broadening measurements at low frequencies with LOFAR Kimon Zagkouris University of Oxford In collaboration with the LOFAR Pulsar Working Group Ierapetra June 2014 Image Credit: David A. Aguilar (CfA) / NASA / ESA
Pulsar Scattering • Interstellar medium (ISM) is not uniform or isotropic • The ISM causes radio waves to: • Disperse • Scatter Lorimer and Kramer (2005) • Scattering → “exponential like” tail. • Thin/thick screen or a uniformly distribution medium. • τdνα B1831-03 Löhmer et al. (2004)
Pulsar Scattering • Observed profile → I ⨂ ISMs ⨂ DMs ⨂ Rs Intrinsic profile • Traditional Measuring τd: • Higher frequency profile → no scattering. • Convolve it with the ISM and instrument functions. • Fit on the observed profile. • Repeat for a range of τd. Best fit →τd . • Drawbacks: • Requires high frequency not scattered profile. • Profile evolution → Wrong τd. ISM ⨂ DMs ⨂ Rs Observed profile
CLEAN based method • Developed by Bhat et al (2003).. • Find maximum of the profile. • Multiply maximum with a gain factor (e.g. 5%). • Convolve this with ISMs ⨂ DMs ⨂ Rs. • subtract it from the profile. • Repeat until the residual profile is noise like • Repeated for a range of τd values. • Best τd → best noise like residual.
CLEAN based method B2111+46 @ 122 MHz (LOFAR HBA) • Best value for τd: • Γ → skewness of the residual. • Fr→ positivity of the residual. • Pvalue→ Kolmogorov-Smirnov test value. • Nf→ total number of iterations. • Minimising Γ+ Fr → best τd value. • CLEAN method: • Finds the value of τd for a given ISM screen model. • Finds the best screen model. • No high frequency profile needed. • Can return the intrinsic profile. Scattered “Cleaned”
LOFAR Observations • Bhat et al. (2004) measurements below DM=100 are from Δνd. 2πτd Δνd ≈ 1. • LOFAR: • LBA 30 – 80 MHz • HBA 120 – 240 MHz • 80 MHz bandwidth. • Continuous band coverage. • If τd ≈P0→ pulsar might not be detected. • LOFAR ideal to explore 10 – 200 DM region with direct measurements of τd. • Measure αwithin LOFAR band. • Check for deviations in low frequency regime.
LOFAR Observations - Results • LOFAR observed ~100 pulsars. • 30 – 40 candidates for scattering measurement. • Only 22 had scattering tails and enough SNR. • 4 – 16 independent measurements within the band. • 3 pulsars had their τdmeasured for the first time at these frequencies. • All 22 sources had only sporadically measurements at low frequencies. • Measured αwithin a continuous frequency band for the first time! This work τd
Frequency dependencyof τd • Theory suggests: • Kolmogorov α≈ -4.4 • Gaussian α ≈ -4 • Measurements: • Bhat (2004) α ≈ -3.86± 0.16 • This work α ≈ -2.64 ± 1.28 • Difference could be because: • We used a thin screen model in all cases. • Different scattering procedure at low frequencies. • Screen truncation Cordes and Lazio (2001) → “flatter” spectrum. • Strong profile evolution. • Multiple screens. • Low SNR -> bigger error for τd and α. Direct measurements ofτd(Lewandowski 2013). Purple filled circles are points of this work.
Intriguing results B0611+22 Some pulsars (e.g. B0611+22) indicate possible break in the powerlaw. Mid-high frequency observations needed. Three pulsar showed a steeper spectrum than expected α ≈ -5.7. Possibly a thin screen model is not the best choice for these cases. This work Τd (msec) B2217+47 Possible break! Frequency (MHz) Τd (msec) Frequency (MHz)
Conclusions and Future work • The road ahead: • LOFAR Cycle 1 and 2 observations -> more scattering measurements. • Time variability of scattering. • Telescopes such as (GBT, Arecibo, GMRT, LWA, MWA) can fill in the frequency gaps to probe for breaks in the power law. • Southern looking telescopes will help increase coverage and the analysis’ statistics. • Cyclic spectroscopy (Demorest 2011) can measure the scattering timescales much more accurate and is the next thing to try! • The story so far: • LOFAR is great to study scattering! • τd and α for 22 pulsars at low frequencies. • Not all pulsars can be used for scattering measurements. • Indications for a different scattering behavior at low frequencies. • CLEAN based method → deconvolved profile → useful for pulsars used in timing experiments. Thank you!