Download
1 / 32
320 likes | 395 Views
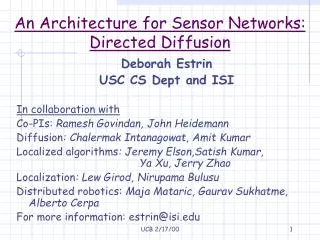
An Architecture to Enable Multi-view Integration for Sensor Deployments in Buildings. Jorge Ortiz Tapia Conference Doctoral Consortium University of California, Berkeley April 3, 2011. Building energy consumption highly fragmented.

E N D
An Architecture to Enable Multi-view Integration for Sensor Deployments in Buildings Jorge Ortiz Tapia Conference Doctoral Consortium University of California, Berkeley April 3, 2011
Building energy consumption highly fragmented • Building Management System captures Heat/cooling and ventilation • Lighting systems • Miscellaneous electrical loads • Weather data, price, etc. • Integration of disparate data source • Enable integrated data collection • Simple integration with external systems (input and output) HVAC: 31.4% +
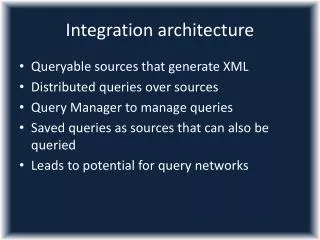
Main research question • What is a good system architecture to • 1) Integrate multiple physical data streams • 2) Combine mathematical and physical modeling with real-time data processing • 3) support a diverse set of monitoring and control applications? • Energy efficient buildings
What are the metrics? • Generality • Supports the integration of many input/output sources • Ease of use • Add/remove input sources, add/remove output targets • Use the metadata to make more informed queries • Querying/Cleaning/Modeling/Sharing the data • Organizing principle: Everything looks like a distributed file system
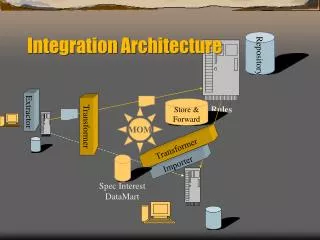
High-level system Architecture Application Interface Integration Modeling Security Metadata Management Message Dispatcher weather weather price Stream processing price Data representation layer BMS Model Manager BMS Zigbee Zigbee WirelessHART Incoming Streams Manager WirelessHART Storage
Why integrate? • Fault detection study[Schein2005] • Fault: Simultaneous heating and cooling • PID controllers on separate schedules Heating coil valve Position varies Outside-air mixer Position varies Cooling coil remains off
Other opportunities for integration • Human-activity classification • Electrical activity [Patel2007] • HVAC air pressure [Patel2008] • Water usage[Froehlich2008] • IP traffic and circuit-level activity [Kim2010]
Savings with intelligent control • SmartThermostat[Lu2010] • Combines motion sensors and contact switches to reduce HVAC energy consumption by 28% • Distributed Wireless Control for Building Energy Management [Marchiori2010] • Devices that share contextual information can control a space more intelligently and save energy (up to 40% on certain appliances).
Integration With Current Systems is Hard
Commercial BMS Architecture Applications Routing/Controllers Field Level
Problems with BMS’s • Not designed to collect all the data • Memory limit at control layer, application layer • Most information is lost through sense-point “bundling” (averaging) • Burden on operator to manage • Building manager is not a data analyst! • Must decide which signals to “trend/unbundle”, monitor (set trigger) • Multi-signal fault detection done by human operator
The world is a nasty place • State-of-art not designed for data collection • 30% of sensors are broken[BEMS2000] • Mixed air reading errors +2.8 Celsius increases cooling energy consumption by 60% [Kao1983] • Mixed are reading errors -2.8 Celsius increases heating energy consumption by 30% [Kao1983] • Imperfect data, imperfect view of physical state • Large accouting errors, false diagnoses, poor forecasting
Integration fills in the gaps Fault Detection • BLAST, DOE-2, EnergyPlus • Integrates building data with model processing • BMS + EnergyPlus[ESL2002]
Lessons learned so far… • Current work optimizes a particular system • More input sources used by control mechanism • Cross-system information flow should be standard and not special case • Developing “smarter” ad-hoc system is time consuming • Many mechanisms are duplicated
Building multiview integration Environment and Activity /SodaHall /hvac /loadtree /spaces /xform /Chiller /CT /panel /floor4 /floor3 Electrical Load Tree Climate plant
Organizing the metadata r-node {“desc”:”Acme” “timestamp”: …} s-node {“desc”:”Outlet” “timestamp”: …} { “desc”:”inventory inside SDH” “timestamp”: … } {“desc”:”Phone” “timestamp”: …} /inventory {“desc”:”Lamp” “timestamp”: …} /mote123 /SodaHall /power /hvac /loadtree /spaces /xform /Chiller /CT /panel /floor4 /floor3 /outlet /vent
Data collection and querying GET /SDH/spaces/*?query=true&props_metertype=powermeter /inventory/mote123 { “metertype”:”powermeter”, “desc”:”Electric power meter”, “timestamp”: 1290500046 } /par /hum /temp /power PID2 PID1 PID3 PID4 GET ?query=true&ts_timestamp=gt:now-100,ls=now PID4 PID1 PID3 PID2 DB Time
Data representation layer / # list resource under URI root [GET] /data # list sense points under resource data [GET] / [sense_point] # select a sense points [GET] /meter # meters provide this service [GET] / [channel] # a particular channel [GET] /reading # meter reading [GET] /format # calibration and units [GET/POST] /parameter # sampling parameter [GET/POST] /profile # history of readings [GET] /report # create and query periodic reports [GET/POST] sMAP Geographical Water Electrical Occupancy Physical Information Environmental Weather Structural Actuator • Narrow-waist for data representation • Simple Metering and Actuation Profile (sMAP)
RESTful + JSONInterface POST http://is4server.com/is4/devices/ mote123/power?pubid=550e8400 PUT http://is4server.com/is4/devices/mote123/ { "Reading": 120, } { "operation":"create_publisher", "resourceName”:”power" } GET http://is4server.com/is4/devices/ mote123/power REPLY: 201 Created { ”pubid":"550e8400", } { “desc”:”Temperature mote”, "Reading": 120, “timestamp”: 1290500046 } PUT http://is4server.com/is4/devices/mote123/power
Sharing real-time feeds StreamFS mote123/power POST http://is4server.com/sub 550e8400 price { "streams":[550e8400], "url":"http://128.32.37.21:8011/sub.php" } BMS Zigbee 41d4 POST REPLY: 201 Created { ”subid":"41d4", } http://128.32.37.21:8011/sub.php http://is4server.com/sub/41d4
Data cleaning and distillation staging Interpolate F1(x) Java/Javascript/Python Extrapolate F2(x) /distillers /inventory/mote123 /interp /filter /power /current /inventory/mote123/power | /distillers/interp| /distillers/filter |http://128.32.37.21:8011/sub.php /procstage/983hfq
Putting it all together(1) GET /…/floor4/room410/*/*?query=true&prop_type=temp /floor4 Interpolate F1(x) Interpolate F1(x) /room410 /mote01 /therm /…/floor4/room410/room410/mote01/temp /…/floor4/room410/room410/therm/temp /temp /temp /…/floor4/room410/room410/mote01/temp?query=true&ts_timestamp=lte:t1,gte:t7 /…/floor4/room410/room410/therm/temp?query=true&ts_timestamp=lte:t1,lte:t7
Putting it all together (2) In-time pipe-chain Continuous pipe-chain t1 /…/floor4/room410/*/*?query=true&type=device | /distillers/ts_getall?ts_timestamp=lte:t1,gte:t7 |/distiller/interp_all?attr=timestamp&unit=1 | /distiller/join?attr=timestamp | http://viewer.com/viewer.php mote01/temp therm/temp t2 t3 t4 t5 t6 t7
Current Status • Public StreamFS implementation • http://is4server.com • Sutardja Dai Hall BMS HVAC system • 400+ live streams • Cory Hall Electrical data • 2500+ live streams • Streaming data rate • ~600-700 Kbps • Almost 300 GB stored
Open questions and upcoming work
y x y x Standard distillationelements User Consistentuniform view Apply regression; Compute “temp” at grid points Provide regression, interpolation, extrapolation functions over space and time values Provide join and filter functions
Streams, models, and resampling • Real-time query optimization • Raw stream data • Post-processed distillation data • Model output data • Physical, mathematical, probabilistic models • Prior work • MauveDB, FunctionDB • Focus on model expression and model-query optimization • TelegraphCQ, Eddies, Psoup • Focus on raw streaming query optimization
Message-passingScalability Streams Subscribers Processing Element Processing Element Processing Element Processing Element Scaling with processing time (p), the number of streams (s), and the number of subscribers (t)
Efficient graph and timeseries queries Inter-relationship analysis Through graph queries Time-series correlation analysis
Architecture is an enabler Proactive detection of inefficient energy use Enables exploration for energy-saving opportunities by focusing on the data
Feedback/Questions? Jorge Ortiz <jortiz@cs.berkeley.edu>