Future Impacts of Climate and Emissions on Air Quality in U.S. National Parks
Learn about the potential impacts of changing climate and emissions on ozone and particulate matter in U.S. National Parks, aiding in air quality management and planning for the future.

Future Impacts of Climate and Emissions on Air Quality in U.S. National Parks
E N D
Presentation Transcript
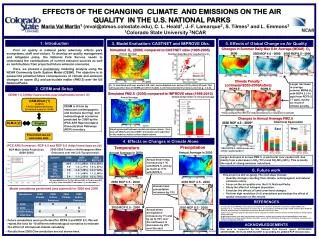
EFFECTS OF THE CHANGING CLIMATE AND EMISSIONS ON THE AIR QUALITY IN THE U.S. NATIONAL PARKS Maria Val Martin1(mval@atmos.colostate.edu),C. L. Heald1, J.-F. Lamarque2, S. Tilmes2 and L. Emmons2 1Colorado State University 2NCAR 1. Introduction 3. Model Evaluation: CASTNET and IMPROVE Obs. 5. Effects of Global Change on Air Quality Changes in Summer Daily Max 8-hr Average (MDA8) O3 Simulated O3 (2000) compared to CASTNET sites (1995-2005) Poor air quality in national parks adversely affects park ecosystems, staff and visitors. To develop air quality management and mitigation plans, the National Park Service needs to understand the contributions of current emission sources as well as contributions from projected future emission scenarios. Here, we present a preliminary modeling analysis using the NCAR Community Earth System Model (CESM). The objective is to assess the potential future consequences of climate and emission changes on ozone (O3) and particulate matter (PM2.5) over the US National Parks. 2000 2050 RCP 4.5 – 2000 2050 RCP 8.5 – 2000 Annual Average Summer Daily Max 8-hr Avg Surface O3 Climate Penalty * (∆Climate=2050-2050Anthro) Larger decrease in average summer MDA8 O3 with RCP4.5 (-14 ppb) than RCP8.5 (-7 ppb), mainly as result of climate penalty. O3 is simulated well over western US, and overestimated over eastern US by about 20 ppb. This strong positive bias in CESM and other models is well documented in previous work [e.g., 3,4,5]. 2. CESM and Setup RCP8.5 RCP4.5 Simulated PM2.5 (2000) compared to IMPROVE sites (1998-2010) CESM 1.0.3 (http://www.cesm.ucar.edu/models/cesm1.0/) Chemical Speciation of Annual Average Annual Average CAM-Chem [1] (CAM-5) 1.9x2.5 spatial resolution 26 vertical levels to ~3 hPa CESM is driven by emissions (anthropogenic and biomass burning) and meteorological scenarios predicted for 2050 by the IPCC AR5 Representative Concentration Pathways (RCP) inventory *It may include the effect of natural emissions in response to climate Changes in Annual Average PM2.5 Chemical Speciation CLM-4 [2] 2050 RCP 4.5 – 2000* Coupler (c) West East Good agreement between model and observations. Fine sea salt (SSLT) and dust (DST) emissions were adjusted in the model to match surface observations. Prescribed sea-ice and ocean data 4. Effects on Changes in Climate Alone IPCC AR5 Scenarios: RCP 4.5 and RCP 8.5 (http://www.iiasa.ac.at/) Precipitation Temperature *2050 RCP8.5 -2000 shows very similar spatial pattern 2000-2050 Trends in Anthropogenic Main Emissions over the U.S (Tg species/yr). RCP Main GHGs Projections (2000-2050) Annual Average in 2000 Annual Average in 2000 Larger decrease in annual PM2.5, in particular over eastern US, due mainly from a decrease in SO4 (70%) and NH4NO3 (60%). This is mostly the result of strong emission reductions. Annual mean temp increases by 1 oC with RCP4.5, and by as much as 3 oC with RCP8.5 6. Future work • This project is still on-going. The next steps include: • Quantify changes resulting from climate, anthropogenic and natural emissions alone. • Focus on the air quality over the U.S. National Parks. • Study the effect of nitrogen deposition. • Consider the effects of land cover/land changes. • Perform high resolution (1x1) simulations and analyze the effect of spatial resolution on the results. *CO and NMVOCs in Tg C/yr; NO and NH3 in Tg N/yr and SO2 in Tg S/yr. Also, indicated % decrease (↓) or increase (↑) 2050 RCP 4.5 - 2000 2050 RCP 4.5 - 2000 Annual mean precipitation increases by 13% Model simulations performed (and planned) for 2000 and 2050 REFERENCES 2050 RCP 8.5 - 2000 2050 RCP 8.5 - 2000 [1] Lamarque et al, CAM-Chem: Description and evaluation of interactive atmospheric chemistry in CESM, GMDD, 2011. [2] Oleson et al., Technical Description of version 4.0 of the Community Land Model (CLM). NCAR Technical Note NCAR/TN-478+STR, National Center for Atmospheric Research, Boulder, CO, 257 pp., 2010. [3] Fiore et al., Characterizing the tropospheric ozone response to methane emission controls and the benefits to climate and air quality, JGR 2008. [4] Murazaki and Hess, How does climate change contribute to surface ozone change over the United States? JGR, 2006. [5] Brown-Steiner and Hess, Asian influence on surface ozone in the United States: A comparison of chemistry, seasonality, and transport mechanism, JGR, 2011. Annual mean precipitation increases by 7% and by up to 70% over the northwest. It decreases by 20% over the east • Future simulations were performed for RCP4.5 and RCP 8.5. We will repeat the runs for 10 different meteorological scenarios to estimate the effect of interannual climate variability. • Results from 2050 Clim simulation are not shown here. ACKNOWLEDGEMENTS This work is supported by the National Park Service (grant H2370094000 /J2350103006). We thank GEIA/ACCENT for providing the gridded RCP emission data.