Download
1 / 19
190 likes | 350 Views
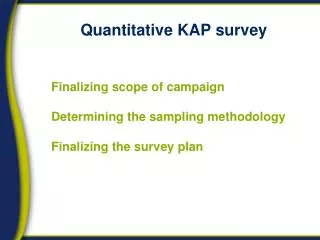
Enriching Social Science with Quantitative and Survey Data. Wendy Olsen and two teams at the University of Manchester April 2014 www.ccsr.ac.uk www.socialsciences.manchester.ac.uk/essted. Overview. 1. INTRODUCTION 2 . SCAFFOLDING vs BRIDGE BUILDING: Methods of scaffolding in general

E N D
Enriching Social Science with Quantitative and Survey Data Wendy Olsen and two teams at the University of Manchester April 2014 www.ccsr.ac.uk www.socialsciences.manchester.ac.uk/essted
Overview • 1. INTRODUCTION • 2. SCAFFOLDING vs BRIDGE BUILDING: Methods of scaffolding in general • 3. Using ‘embedded quantitative methods’ in sociology • 4. EXAMPLES from Sociology
Abstract: To meet the need for more use of social data in Sociology and Politics classrooms, we encourage a pedagogy that uses active learning and the building of bridges among a variety of relevant skills. This talk provides a review of what we know so far from our curriculum initiative in this area. Firstly we review the term ‘scaffolding’ which refers to helping students upward in their learning curve (Anghileri, 2006). To uphold scaffolding we need numerous explicit 'learning outcomes' and we need to enable students to practice both orally and in writing. Secondly we argue that bridge-building is also needed - i.e. to embed quantitative data in classrooms ideally combining the theory-critique and analysis skills of a social-science degree with the empirical skills associated with using data. Thirdly we conclude by giving examples of sociology class exercises that have worked well in our project. These relate to the sociology of family life and to attitudes about sexuality. Overall the students' active learning was prompted by the exciting use of spreadsheets and graphs, the introduction of classroom exercises and even 'flipped' classrooms or lectorials, and staff working in teams with diverse specialist knowledge.Wendy Olsen 2014
1. Introduction to ESSTED • PIPS Component: • Patterns in Politics & Society • Working on Expanding the Enrichment of Social Science Classrooms with Quantitative Data & Quantitative Methods • A Researcher Development Initiative of ESRC • CURRICULUM INNOVATION COMPONENT: • Ten course units • Embedding and enrichment, not substitution • Teamwork
People • Wendy Olsen (Principal Investigator / senior lecturer) • Mark Brown (Principal Investigator / senior teaching fellow) • Jacqui Carter MIMAS and ESDS • Jo WathanUK Data Service and Census • Jen Buckley (Cathie Marsh Centre for Census & Survey Research) • Tarani Chandola, Kingsley Purdam, Brian Heaphy, Andrew Russell
2. Scaffolding and procepts • Methods of scaffolding in using ‘embedded quantitative methods’ in sociology/politics. • Scaffolding means building up knowledge through practice in using the words and practices of building blocks.
Briefing Paper Number 1 • See our web site by searching for ESSTED It holds briefing paper 1 on scaffolding, briefing paper 2 on data for dissertations, and video hotlinks.
Scaffolding depends on procepts idea. • A procept is a process+concept combination, which, with practice, can be used in a habitually rapid way. Thus how the person uses the process+concept changes over time – • … they get faster. • Teach them to use procepts, ie simple building-blocks of knowledge. • …they get better at doing it.
Examples of procepts • Applying a theory to a vignette. • Questioning the underlying units that are assumed in a theory – the marriage, the couple, the person… • Interpreting a table in terms of %s • Considering an association between X and Y • Recognising that a Concept may be an ‘X’ (e.g. ‘violent behaviour toward wife’) or a Y (e.g. ‘divorce Yes/No’).
3. Meaning of Embedding vs Enriching the Curriculum Embedding means putting the quantitative data and methods into the substantive Year 1-2-3 course units, such as Ethnicity, Family Life, Sexualities, Sociology of Religion etc. This builds on scaffolding ideas. We n eed to have an open ming. Enriching means having more social science content in the so-called “Quantitative Methods” course units. These should cover “Research Methods” generally. They should use more than ‘beans’, ‘white/black’ crude examples.
Methods of Embedding/Using • Building bridges between methods • EXAMPLES: Use cluster analysis from an advanced journal article, and link that back to the IDEAL TYPE idea in Weber and to TYPOLOGY in the case-study methods. • Use regression in Year 2/3 reading lists, again citing the Peer Reviewed Journal Articles – be very selective. • Help students to grasp these articles, suggesting pages which they should print and take notes on. • Students practice, practice... ...tacit learning • Make sure the curriculum has a range of skills— • graphs, tables, %’s, regression, correlation • generalisation, inference, abduction from mixed data
4. Glimpses of Examples Excel is a means to provide information to students in Year 1. Simplify the evidence! Use a 5-pg or 1-page handout of tables. Too messy! Needs collapsing and simplifying! Data from Understanding Society on Solo Living and Life Satisfaction 2010 Excellent Labelling (URL! Dates! Data source!
Student Moves Upward on the Scaffolding Toward the Top User of Microdata Maker of Tables, Graphs Critical Reader of Data Critical Reader of Data
Student Moves Around on Scaffolding User of Microdata Maker of Tables, Graphs Critical Reader of Data Critical Reader of Data Rethinks, questions the usual interpretation
Our Online Materials Show QM in This Context www.socialsciences.manchester.ac.uk/essted
Conclusions • Thank you for listening