Download
1 / 15
270 likes | 1.03k Views
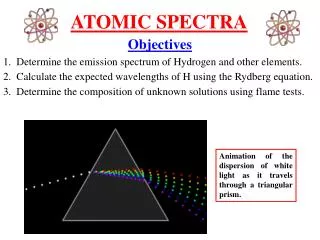
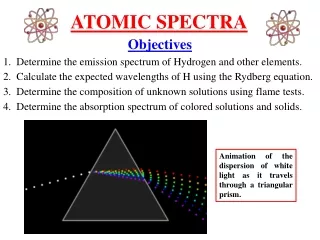
Atomic Spectra. Lab 1. Light. If we pass light through a prism or diffraction grating, we can see the intensity as a function of wavelength. Type of Spectrum. Solids, liquids, and dense gases emit light of all wavelengths, without any gaps – or a continuous spectrum.

E N D
Atomic Spectra Lab 1
Light If we pass light through a prism or diffraction grating, we can see the intensity as a function of wavelength.
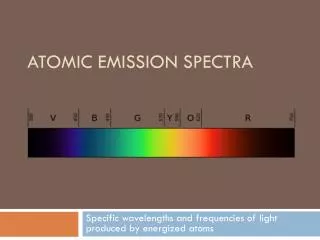
Type of Spectrum Solids, liquids, and dense gases emit light of all wavelengths, without any gaps – or a continuous spectrum
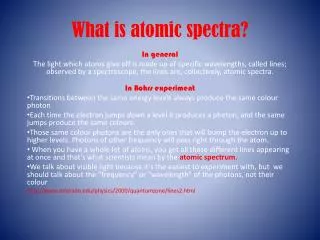
Thin gases emit light of only a few wavelengths - an emission or bright line spectrum.
If there is a source of light behind it, a thin gas will absorb light of the same wavelengths it emits • this is called an absorption or dark line spectrum.
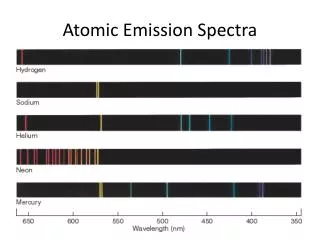
Balmer lines • each element generates its own unique set of wavelengths of emission or absorption • Balmer studied the optical spectrum of hydrogen and found a pattern in the wavelengths of its emission lines
Balmer series – set of visible lines in H spectrum • For H, the wavelengths are - 374.9 377.0 379.7 383.4 388.8 396.9 410.1 433.9 486.0 656.1 • a simple formula reproduces these wavelengths • λ (n) = (364.5 nm * ( n2 /n2 – 4)) where n = 3, 4, 5, …..
other scientists found similar patterns in other portions of the electromagnetic spectrum
Paschen series • Paschen, in the infrared, measured lines with wavelengths 866.2 874.8 886.0 901.2 922.6 954.3 1004.6 1093.5 1281.4 1874.5 which matched the series • λ (n) = (820.5 nm * ( n2 /n2 – 9)) where n = 4, 5, 6, …..
Lyman series • Lyman, in the ultraviolet, a series of lines with wavelengths 91.9 92.1 92.3 92.6 93.0 93.7 94.9 97.2 102.5 121.5 corresponding to the series • λ (n) = (91.1 nm * ( n2 /n2 – 1)) where n = 2, 3, 4, …..
In fact, scientists soon realized that hydrogen's spectrum could be broken down into a large number of series, each of which had wavelengths obeying a formula like • Λ (n,k) = (limit) * ( n2 /n2 – k2)) where n=k+I, k+2,…. • The Lyman series corresponds to k=1 with a limit of 91.1 nm, the Balmer series to k=2 with a limit of 364.5 nm, and so forth