Performance Evaluation of a DBMS
340 likes | 543 Views
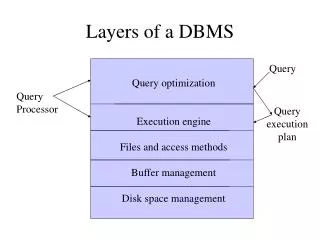
Performance Evaluation of a DBMS. Shahram Ghandeharizadeh Computer Science Department University of Southern California. Challenge. Imagine you develop the next super-duper buffer replacement technique, named SUPER. How will you compare its performance with another technique, say LRU-K?

Performance Evaluation of a DBMS
E N D
Presentation Transcript
Performance Evaluation of a DBMS Shahram GhandeharizadehComputer Science Department University of Southern California
Challenge • Imagine you develop the next super-duper buffer replacement technique, named SUPER. • How will you compare its performance with another technique, say LRU-K? • Using a scientific approach.
Scientific Evaluation • A controlled environment where only one variable is changing: • E.g., either SUPER or LRU-K is used. • The environment measures a metric of interest to compare the two techniques.
Step 1 • Decide what metric you want to emphasize when comparing SUPER with LRU-K. • Conceptual: Response time • Average person walking on Exposition will understand you as “saving time”. There is general consensus that time is money. • Physical: Cache hit ratio, Byte hit ratio • Average person will not understand you unless they have some understanding of a computer system and its hierarchical memory. • You need an apple-to-apple comparison
Step 2: Fix Environmental Variables • Identify a database and a workload to compare SUPER with LRU-K. • If a target application exists then: • Take a snap-shot of its database, • Write a sniffer to record the requests accessing your data. • Perform a trace-driven evaluation by playing back the recorded requests against LRU-K and SUPER managing your identified database. • Most often the target application does not exist.
Step 2 (Cont…) • If a target application does not exist then design a synthetic workload consisting of: • A database with a pre-specified number of records, • Fix-sized records numbered 1 to N. • Manipulate value of N to build small and large DBs. • And a workload generator that accesses these records. Must answer two key questions: • What data is accessed? • When is the data accessed?
What data to access? • Most often, certain data items are more popular than others. • 90-10 rule: 90% of accesses reference 10% of data items. • 80-20 rule: 80% of accesses reference 20% of data items. • Etc. • How? • Use a Zipfian distribution of access and manipulate the mean of the distribution.
Motivation for Zipf • Zipf distributions have been shown to characterize use of words in a natural language (like English) and the popularity of library books, so typically • a language has a few words ("the", "and", etc.) that are used extremely often, and a library has a few books that everybody wants to borrow (current bestsellers) • a language has quite a lot of words ("dog", "house", etc.) that are used relatively much, and a library has a good number of books that many people want to borrow (crime novels and such) • a language has an abundance of words ("Zipf", "double-logarithmic", etc.) that are almost never used, and a library has piles and piles of books that are only checked our every few years (reference manuals for Apple II word processors, etc.)
Implementation of Zipf • Assuming C records are rank ordered based on their popularity: 1, 2, …, C. • With a Zipf-like distribution, the probablity of access to record j is a function of 1/power(j, u); see example in the next slide. • Value of u dictates the mean of the distribution. It is greater than or equal to zero and less than or equal to one. • X is 1 divided by the sum of power(j,u) for all clips. • Code is available from http://dblab.usc.edu/ under software download.
Example of Zipf • Assume mean of distribution is 0.27 and the database consists of 3 records: 1, 2, and 3 • Record 1, power(1,0.27) = 1, 1/power(1,0.27) =1 • Record 2, power(2,0.27) = 1.21, 1/power(2,0.27)=0.83 • Record 3, power(3,0.27) = 1.35, 1/power(3,0.27)=0.74 • X = (1 + 0.83 + 0.74) = 2.57 • Record 1, probability of access 1/2.57 = 0.39 • Record 2, probability of access 0.83/2.57 = 0.32 • Record 3, probability of access 0.74/2.57 = 0.29
When to Issue Requests? • It depends on the assumed simulation model: • Closed simulation models: • Consists of a fixed number of clients. • A client issues a request and does not issue another until its pending request is serviced. • The client may wait a pre-specified amount of time before issuing a new request. This delay is termed “think time”. • Open simulation models: • A process issues an average number of requests per unit of time. This is termed request arrival rate. It is denoted as lambda: λ
Closed Simulation Models A technique (LRU-K) is better if it provides a higher throughput relative to the other technique as a function of the number of clients. Throughput LRU-K SUPER Multiprogramming level
Open Simulation Models A technique (SUPER) is better if it supports a higher arrival rate without formation of queues. A slower technique results in queues with lower arrival rates. Average Response Time LRU-K SUPER Arrival rate, λ
Validate Your Simulation Model • How do you know your simulator has no bugs?
Validate Your Simulation Model • How do you know your simulator has no bugs? • Analytical models compute the response time of a system based on certain assumptions, e.g., a Poisson arrival rate. • Analytical assumptions are most often trivial: typically, they simplify the range of values allowed by a component of the simulation model. • Implement the assumptions and verify each component produces response times that match the analytical models. A divide-and-conquer approach.
Divide & Conquer • Validate components one at a time. • Example: how do you validate your implementation of a Zipfian reference pattern?
Divide & Conquer • Validate components one at a time. • Example: how to validate your implementation of a Zipfian reference pattern? • Assume a databases of few objects, say 10. • Use the analytical models to estimate the frequency of access to each object. • Run the Zipfian component of your simulator for a fixed number of requests (say 100,000) and measure the frequency of access to each object. • Items 2 and 3 should match very closely.
10 Commandments of Simulation Studies Shahram Ghandeharizadeh Computer Science Department University of Southern California
Outline • Why simulation studies? • 10 Commandments of simulation studies. • Review of each commandment. • Conclusions • References
Why simulation models? • To understand tradeoffs between alternative ways of implementing a functionality when: • A realistic implementation is too expensive/time-consuming. • Quantify the complexity of alternative implementations prior to a real system prototyping effort. Make sure it is not over-engineered: Many fold increase in software to get a 2% benefit? • Quantify tradeoffs with alternative strategies and choose the most appropriate one. • Gain insight to implement better strategies.
Why simulation models? • There are other reasons for developing a simulation model that falls beyond the scope of CSCI485: • To describe and understand systems too complex to explain, e.g., the human brain. • To identify factors/conditions with most impact on a performance metric, e.g., airplane crash in Singapore during a hurricane. Typically conducted using traces gathered from a real environment. • Capacity planning and risk analysis, e.g., design of power grids in anticipation of 20% increase in peak load in 2010, war-games.
Inherent limitation • A simulation is abstraction of a real system that may either exist or foreseen to exist in the future. • How do you know the abstraction level is correct?
Inherent limitation • A simulation is abstraction of a real system that may either exist or foreseen to exist in the future. • How do you know the abstraction level is correct? • We cannot know what we do not know. • We can never be sure that we have accounted for all aspects that could affect a simulation model’s ability to provide meaningful results. • Items 1 and 2 are specially true for future foreseen applications that do not exist today.
Alternatives to a simulation • An implementation is specific and most often static. A simulation study can model a variety of possible system parameters, e.g., memory sizes in support of different buffer pool frames. More Specific More Abstract
Alternatives to a simulation • A real prototype is more expensive to design, implement, test, and maintain. Expensive Cheaper
Alternatives to a simulation • Analytical models are more general, providing insights that might be overlooked by a narrow implementation. Narrow General
Components of a Simulator • Abstraction of a computing environment. • A buffer pool with a fixed number of frames. • Implementation of alternative strategies. • LFU, LRU, LRU-K • Abstractions of an application. • How requests are issued? Uniformly or in a bursty manner? • What processing is required from the system? • Key metric?
10 Commandments • Thou shall NOT obtain results from a computing environment unless its behavior is validated. • Thou shall NOT obtain results from an incorrect implementation of your strategies. • Thou shall NOT use unrealistic computing environments. • Thou shall NOT use unrealistic workloads or applications. • Thou shall NOT use someone else’s computing environment as the basis for your implementation unless you understand its abstractions and behavior for different parameter settings. • Thou shall NOT focus on absolute values. (Focus on the observed trends.)
10 Commandments (Cont…) • Thou shall NOT make a big deal out of less than 15% difference. • Did the LRU-K paper show cache hit ratios higher than 15%? If not, how did it address this commandment? • Thou shall NOT report on a simulation with a few runs; establish statistical confidence. • Thou shall NOT publish results obtained from a simulator without disclosing all your assumptions. (Results must be reproducible by an independent scientist.) • Thou shall NOT perceive simulation as an end in itself. Validate your results against a real implementation. Techniques that appear feasible in a simulation study might be infeasible to implement.