Download
1 / 67
670 likes | 706 Views
Explore the methods, goals, and models used in genetic recombination and linkage analysis to understand disease etiology, identify drug targets, and map genes. Learn about QTL mapping, map functions, meiosis, and more.

E N D
The genetic approach • Start with the phenotype; find genes the influence it. • Allelic differences at the genes result in phenotypic differences. • Value:Need not know anything in advance. • Goal • Understanding the disease etiology (e.g., pathways) • Identify possible drug targets
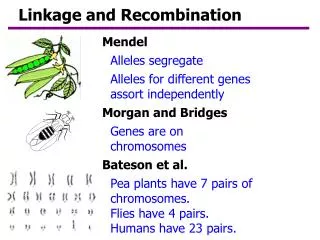
Approaches togene mapping • Experimental crosses in model organisms • Linkage analysis in human pedigrees • A few large pedigrees • Many small families (e.g., sibling pairs) • Association analysis in human populations • Isolated populations vs. outbred populations • Candidate genes vs. whole genome
Outline • A bit about experimental crosses • Meiosis, recombination, genetic maps • QTL mapping in experimental crosses • Parametric linkage analysis in humans • Nonparametric linkage analysis in humans • QTL mapping in humans • Association mapping
The data • Phenotypes,yi • Genotypes, xij = AA/AB/BB, at genetic markers • A genetic map, giving the locations of the markers.
Goals • Identify genomic regions (QTLs) that contribute to variation in the trait. • Obtain interval estimates of the QTL locations. • Estimate the effects of the QTLs.
Phenotypes 133 females (NOD B6) (NOD B6)
Statistical structure • Missing data: markers QTL • Model selection: genotypes phenotype
Genetic distance • Genetic distance between two markers (in cM) = Average number of crossovers in the interval in 100 meiotic products • “Intensity” of the crossover point process • Recombination rate varies by • Organism • Sex • Chromosome • Position on chromosome
Crossover interference • Strand choice • Chromatid interference • Spacing • Crossover interference • Positive crossover interference: • Crossovers tend not to occur too • close together.
Recombination fraction We generally do not observe the locations of crossovers; rather, we observe the grandparental origin of DNA at a set of genetic markers. Recombination across an interval indicates an oddnumber of crossovers. Recombination fraction = Pr(recombination in interval) = Pr(odd no. XOs in interval)
Map functions • A map function relates the genetic length of an interval and the recombination fraction. r = M(d) • Map functions are related to crossover interference, but a map function is not sufficient to define the crossover process. • Haldane map function: no crossover interference • Kosambi: similar to the level of interference in humans • Carter-Falconer: similar to the level of interference in mice
Models: recombination • We assume no crossover interference • Locations of breakpoints according to a Poisson process. • Genotypes along chromosome follow a Markov chain. • Clearly wrong, but super convenient.
The simplest method “Marker regression” • Consider a single marker • Split mice into groups according to their genotype at a marker • Do an ANOVA (or t-test) • Repeat for each marker
Marker regression Advantages • Simple • Easily incorporates covariates • Easily extended to more complex models • Doesn’t require a genetic map Disadvantages • Must exclude individuals with missing genotypes data • Imperfect information about QTL location • Suffers in low density scans • Only considers one QTL at a time
Interval mapping Lander and Botstein 1989 • Imagine that there is a single QTL, at position z. • Let qi = genotype of mouse i at the QTL, and assume yi | qi ~ normal( (qi), ) • We won’t know qi, but we can calculate (by an HMM) pig = Pr(qi = g | marker data) • yi, given the marker data, follows a mixture of normal distributions with known mixing proportions (the pig). • Use an EM algorithm to get MLEs of = (AA, AB, BB, ). • Measure the evidence for a QTL via the LODscore, which is the log10 likelihood ratio comparing the hypothesis of a single QTL at position z to the hypothesis of no QTL anywhere.
Interval mapping Advantages • Takes proper account of missing data • Allows examination of positions between markers • Gives improved estimates of QTL effects • Provides pretty graphs Disadvantages • Increased computation time • Requires specialized software • Difficult to generalize • Only considers one QTL at a time
LOD thresholds • To account for the genome-wide search, compare the observed LOD scores to the distribution of the maximum LOD score, genome-wide, that would be obtained if there were no QTL anywhere. • The 95th percentile of this distribution is used as a significance threshold. • Such a threshold may be estimated via permutations (Churchill and Doerge 1994).
Permutation test • Shuffle the phenotypes relative to the genotypes. • Calculate M* = max LOD*, with the shuffled data. • Repeat many times. • LOD threshold = 95th percentile of M*. • P-value = Pr(M* ≥ M)
Going after multiple QTLs • Greater ability to detect QTLs. • Separate linked QTLs. • Learn about interactions between QTLs (epistasis).
Before you do anything… Check data quality • Genetic markers on the correct chromosomes • Markers in the correct order • Identify and resolve likely errors in the genotype data
Software • R/qtl http://www.rqtl.org • Mapmaker/QTL http://www.broad.mit.edu/genome_software • Mapmanager QTX http://www.mapmanager.org/mmQTX.html • QTL Cartographer http://statgen.ncsu.edu/qtlcart/index.php • Multimapper http://www.rni.helsinki.fi/~mjs
Before you do anything… • Verify relationships between individuals • Identify and resolve genotyping errors • Verify marker order, if possible • Look for apparent tight double crossovers, indicative of genotyping errors
Parametric linkage analysis • Assume a specific genetic model. For example: • One disease gene with 2 alleles • Dominant, fully penetrant • Disease allele frequency known to be 1%. • Single-point analysis (aka two-point) • Consider one marker (and the putative disease gene) • = recombination fraction between marker and disease gene • Test H0: = 1/2 vs. Ha: < 1/2 • Multipoint analysis • Consider multiple markers on a chromosome • = location of disease gene on chromosome • Test gene unlinked ( = ) vs. = particular position
Missing data The likelihood now involves a sum over possible parental genotypes, and we need: • Marker allele frequencies • Further assumptions: Hardy-Weinberg and linkage equilibrium
More generally • Simple diallelic disease gene • Alleles d and + with frequencies p and 1-p • Penetrances f0, f1, f2, with fi = Pr(affected | i d alleles) • Possible extensions: • Penetrances vary depending on parental origin of disease allele f1 f1m, f1p • Penetrances vary between people (according to sex, age, or other known covariates) • Multiple disease genes • We assume that the penetrances and disease allele frequencies are known
Likelihood calculations • Define g = complete ordered (aka phase-known) genotypes for all individuals in a family x = observed “phenotype” data (including phenotypes and phase-unknown genotypes, possibly with missing data) • For example: • Goal:
The parts • Prior = Pop(gi) Founding genotype probabilities • Penetrance = Pen(xi | gi) Phenotype given genotype • TransmissionTransmission parent child = Tran(gi | gm(i), gf(i)) Note: If gi = (ui, vi), where ui = haplotype from mom and vi = that from dad Then Tran(gi | gm(i), gf(i)) = Tran(ui | gm(i)) Tran(vi | gf(i))
The likelihood Phenotypes conditionally independent given genotypes F = set of “founding” individuals
That’s a mighty big sum! • With a marker having k alleles and a diallelic disease gene, we have a sum with (2k)2nterms. • Solution: • Take advantage of conditional independence to factor the sum • Elston-Stewart algorithm: Use conditional independence in pedigree • Good for large pedigrees, but blows up with many loci • Lander-Green algorithm: Use conditional independence along chromosome (assuming no crossover interference) • Good for many loci, but blows up in large pedigrees
Ascertainment • We generally select families according to their phenotypes. (For example, we may require at least two affected individuals.) • How does this affect linkage? If the genetic model is known, it doesn’t: we can condition on the observed phenotypes.
Model misspecification • To do parametric linkage analysis, we need to specify: • Penetrances • Disease allele frequency • Marker allele frequencies • Marker order and genetic map (in multipoint analysis) • Question: Effect of misspecification of these things on: • False positive rate • Power to detect a gene • Estimate of (in single-point analysis)
Model misspecification • Misspecification of disease gene parameters (f’s, p) has little effect on the false positive rate. • Misspecification of marker allele frequencies can lead to a greatly increased false positive rate. • Complete genotype data: marker allele freq don’t matter • Incomplete data on the founders: misspecified marker allele frequencies can really screw things up • BAD: using equally likely allele frequencies • BETTER: estimate the allele frequencies with the available data (perhaps even ignoring the relationships between individuals)
Model misspecification • In single-point linkage, the LOD score is relatively robust to misspecification of: • Phenocopy rate • Effect size • Disease allele frequency However, the estimate of is generally too large. • This is less true for multipoint linkage (i.e., multipoint linkage is not robust). • Misspecification of the degree of dominance leads to greatly reduced power.
Other things • Phenotype misclassification (equivalent to misspecifying penetrances) • Pedigree and genotyping errors • Locus heterogeneity • Multiple genes • Map distances (in multipoint analysis), especially if the distances are too small. All lead to: • Estimate of too large • Decreased power • Not much change in the false positive rate Multiple genes generally not too bad as long as you correctly specify the marginal penetrances.