Download
1 / 52
530 likes | 809 Views
Creating Thematic Maps & Introducing ArcCatalog. Introduction to Mapping & GIS. Types of Maps. General purpose maps can be used for many different applications. Topo maps can be used for general orienteering, hiking, wayfinding, etc

E N D
Creating Thematic Maps & Introducing ArcCatalog Introduction to Mapping & GIS
Types of Maps • General purpose maps can be used for many different applications. • Topo maps can be used for general orienteering, hiking, wayfinding, etc • Specific purpose maps generally overemphasize and generalize features to highlight specific map elements • Line maps overemphasize routes or rail lines while omitting parks, wetlands, etc
General Purpose Map • Road map • Atlas • Political maps • USGS topographic maps
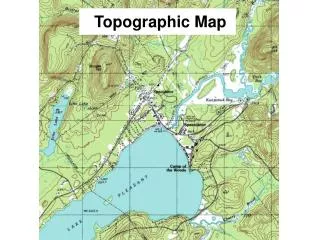
USGS Topographic Maps • For the US, prepared by the USGS. • Nearly 60,000 maps in the 7.5' series, covering the lower 48, Hawaii, and parts of Alaska. • Depicts a massive amount of information. • Paper versions being phased out for digital versions.
Edge Roads Rails Urban lands Forests Orchards Water SignificantBuildings ElevationContours Benchmarks New Features
Specific Purpose Maps • Specific purpose maps emphasize or omit information to make the theme of the map more apparent. • Thematic maps are maps that depict a theme and can often be used only for explaining that theme.
Making Maps with ArcMap • Choropleth Maps • Dot Density Maps • Chart Maps • Symbol Maps
Map Documents (MXD) • ArcMap Document extension is .mxd • MXDs store: • Layers in map frame • Layer properties • Symbology • Classification • Drawing order • Multiple map frames • Data Joins
Printing Maps • View display vs. layout display • Move data frames • Resize data frames • Data frame zoom versus layout zoom • Inserting map elements • Legend • Scale • North Arrow • Titles & Text
Choropleth Maps • Areas are colored based on an attribute • Attribute values are arranged in classes • Various classification methods • Attribute shown as uniform throughout area • Certain attributes, like population, are best shown as normalized values (pop density)
New Jersey Population • Normalizing an attribute by dividing its value by the area or using the percentage of the sum makes more meaningful maps. • New Jersey mapped by county • "Whole value" population • Population Density (pop/area)
Gloucester County Population • Municipalities by "raw" population and by population density.
Dot Density Maps • For a given attribute of the area, a value is assigned to a dot placed within its boundaries. • Number of dots within the area multiplied by the value of each dot yields the attribute value. • For a town with 20,000 people and a dot value of 500, 40 dots are placed on the map.
Placement Hinting • By default, ArcMap (and any other GIS) will place the dots randomly throughout the area. • Values do not occur randomly within an area. • Additional layers must be provided to give the rendering engine hints as to where the dots belong.
Same data, different maps. • Two maps showing "Total Acres of Land in Orchards" • Same data, different symbologies, different maps.
Graduated Symbols • Instead of coloring or adding dots to each area, we place a symbol within the area to represent the value of the attribute. • Symbols can be varied by size. • Symbols can also vary by color and shape, but usually to denote differences in another attribute.
Proportional Symbols • Similar to graduated symbols, proportional symbols vary by size based on the attribute to be mapped. • Unlike graduated, there are no classes. • Minimum and maximum are defined, and the size varies between the two in a linear fashion.
Chart Maps • Instead of a simple graphic to represent the attribute, chart maps use graphic elements commonly found on charts. • Bar charts & pie charts • Beware of visual clutter when mapping many areas • Instead of 566 municipalities, map 21 counties
Chart Maps • Pie charts can show breakdown of population and total population, by varying the size of the pie chart itself. • Make sure your attributes make sense in a pie chart. • Don't map 2000, 1990, 1980 population using a pie chart • Make sure your variables don't overlap.(i.e. "Hispanic" in the Census)
ArcGIS - 3 part interface • ArcMap – for creating presentation graphics • ArcCatalog – for navigating spatial data • ArcToolbox – powerful geoprocessing tools
ArcMap: Map View Menu bar Standard Toolbar Tools Toolbar Canvas or Map Frame Table of Contents Draw Toolbar Right clicking an object brings up context menu that displays various optionsHolding your mouse over a tool will bring up a tool tip.
ArcCatalog: Managing GIS Connect toWorkspace Metadata Bar Tools Toolbar Location Bar Catalog Contents Catalog View/Preview Frame/ Metadata Browser
Saving your work in ArcGIS • Map Documents (.mxd)—Saves a snapshot of all the layers that are loaded into the map canvas BUT does NOT save the data layers themselves. • Layer Files (.lyr)—Saves the way a data file is rendered on screen. Again, the data source itself is not copied, but instead referenced by the layer file • GIS Data File (many possible types)—ArcGIS can utilize many different types of GIS and image data. Each data file is treated as a “layer” of information in the table of contents.
ArcMap vs ArcCatalog You will use ArcMap to create .mxd and .lyr files. You will use ArcCatalog to manage your GIS data and workspaces.
ArcCatalog • ArcCatalog is similar to Windows Explorer(aka “My Computer” on your Windows desktop). • It is a tool for navigating through your GIS datasets. The benefit of using ArcCatalog is that it has been specially designed for use with spatial data. ArcCatalog is used to copy, delete, rename and modify spatial data sets. Using Windows Explorer can ruin data sets if these same tasks are done using it.
Viewing Data Files in ArcCatalog • You can view data in three ways: • Contents • Shows what’s inside the folder or dataset • Preview • Shows what data set contains can be viewed as spatial feature or attribute table associate with feature by switching view at the bottom of the contents window • Metadata • Data about your data.
ArcCatalog: Previews • Using ArcCatalog you can easily preview both your spatial datasets, and the attribute data associated with them
ArcCatalog:Data Management • ArcCatalog is provides an environment where it is safe to cut and paste spatial data into new directories, and even into the newest ESRI spatial data structure, the geodatabase. Additionally, several common conversion routines are available from ArcCatalog
ArcCatalog: Metadata ArcCatalog includes tools for viewing and editing Metadata. It even has an option to automatically update some items in the metadata whenever a dataset is edited.