Download

1 / 32
320 likes | 335 Views
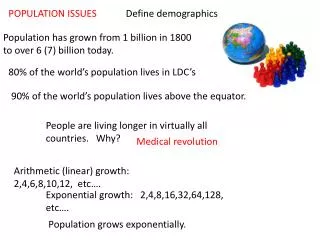
Learn about the population of the world and specific regions like Abbotsford. Understand population change, measurement, and factors affecting population growth. Explore concepts such as demography, census, birth rate, death rate, immigration rate, emigration rate, and population growth rate.

E N D
What is the population of the world? What is the population of Abbotsford? Write down your answer.. Share with a friend..
Learning Outcomes: Define some basic terms regarding population studies. You will determine and practice how population change is measured through using a formula..
Task 1: Read 358-359 Define the following: 1. Demography 2.Census 3. Developed Country 4. Developing Country 5.Birth Rate 6. Death Rate.
Task 2: Read 362-364 Look at Figure 11-10 this is how Population Growth Rates are determined... Draw a similar example in your notebook but change the numbers slightly so that you have a different result when you do the math... Define:7. immigration rate,8.emigration rate, 9.NI,10.exponential rate, 11.rule of 70, 12.doubling time,13. net migration..
Task 3 -Pg 364- Use the Concept Definition Map Pg. 123 for the term Population Growth Rate
Review.. Demography Census developed country birth rate immigration rate
Review Net Migration Doubling Time Natural Increase Emigration Rate Developing Country
Preview: What is the life expectancy of a Canadian Citizen? Where is the highest Life expectancy in the world? Where is the lowest life expectancy in the world? Write down your best guess..
Learning Outcomes: Today you will learn about the factors affecting life expectancy and how it has changed. You will also interpret statistics.. You will also explain the stages of the DTM and how it is connected to economic growth in the country...
Task 1 Read Pg.365 Use concept definition map to define: Life Expectancy Use Figure 11-12--- Answer- Interpreting Stats.
Task 2-- 1. Write out the the term DTM... Create a chart: Across the top Give the stages and names..... Down the side write the following: Birth Rate Death Rate Growth Rate Level of Industrialization Health Care Numbers of Elderly Numbers of Young Name of 2 countries in this stage Problems
Task 3: 368/369 1. Fill in your chart. 2. Will countries always move to the next stage of the DTM towards a higher stage?Why/Why not? 3. Could a country move to a lower stage?Explain 4. What types of population issues is Canada facing? 5.China is at stage 3, what measures have they used to slow population growth? How successful has their plan been? 6. What has India done to slow their population?Describe the success of their plan.
Learning Outcomes: Create a population pyramid graph using data. Analyse population pyramids and make inferences about the countries economy, society, population distribution. Identify different types of pyramids. Describe the importance of dependency ratio.
Task 1 Complete Population Pyramids Assigned
Task 2: Bulgaria/India- Population Pyramids 1. Do you think Bulgaria/India is a developing or developed country? Explain 2. Predict some future population issues that Bulgaria and India might face in the future. 3. Identify solutions to these issues. 4. What would the dependency ratios be like in Bulgaria and India. 5. How might these dependency ratios affect these countries? Give two specific examples.
Task 3 Read 371-377 1. Using Figure 11-18- Caterogize each pyramid using 11-17... 2. Answer:#1,#4 and #5 -Figure 11-18 3. Figure 11-19- Answer #1 and 2 4. Use Concept Definition Map to define Dependency Ratio..Pg. 123 5. Pg. 374-Practice Questions-Answer: 1,2,and 3. 6. Why is immigration so important to Canada's population and economy?
Learning Outcomes Today you will analyse two different maps to understand the difference between population density and population distribution. You will also identify the functions that affect density.
Review--- Developing countries usually have a: a. stable pyramid or b. expanding pyramid. Dependency Ratio always means: a. high numbers of old people to young people b. high numbers of young people to old people c. the proportion of the population supported by the working
Task 1- Use 2 Concept Definition Maps for the terms: Population Distribution and Population Density... Use Information from Pg. 380-382 to help you fill in the Map..
Draw a map of a country: Include some cities,water, mountains etc... Show the population distritubtion using symbols and numbers---- Fast forward 10 years, Draw the same country and change the pattern of distribution Exchange with a friend… Ask them how the distribution has changed and possible reasons why?
Draw another map of a country: Show the population density using symbols/shading or other methods…. Fast forward 10 years… Draw the same country and change the density patterns…. Exchange with a friend… Ask them how the density has changed and possible reasons why?
Population Project: Population Statistics Step 1: Make up a name for your fictious country Step 2: Draw a map for your fictious country. Include- Physical features as well as towns and cities. Colour and include a key. Step 3: Determine whether your country is developed or developing Step 4: Determine your countries birth and death rate Step 5: Determine your countries immigration and emigration rates Step 6: Determine your countries Population Growth Rate Step 7:Determine the Life Expectancy- List 3 contributing factors
Step 8- Look at figure 11-13- Based on your birth,death and pop growth rate determine what stage of the demographic transition model your country is. Step 9- Go to figure 11-17 Determine which population pyramid reflects your countries birth and death rates. Step 10- Create a population pyramid (like figure 11-18) That represents your country accurately notice the big differences between developing countries like Chad and developed countries like Japan. Step 11- Determine the dependency load and ratio for your country.(pg. 373) Step 12- Look at your map and create a method to show population distribution in your country(Pg. 380)
Step 13- Display population density on your map. Pg 381(Figure 11-26 Step 14- Create a key to show why people live where they do. Figure 11-27. Human and physical factors… Final Chart Describe the problems or issues that your country faces with regards to their:birth rate, death rate, pop. growth rate,life expectancy, dependency load, pop. distribution, pop. density. What are potential solutions to these problems and what might be the problems implementing these solutions.
Rubric 4- Map is constructed including all of the above steps which are easily identified, population statistics reflect a high level of understanding regarding the difference between a developed and a developing country. Population pyramid includes all correct info and design is consistent with examples provided.. Chart demonstrates a high level of understanding complex population problems, possible solutions and diffiiculties are identified and examples of problems implementing solutions are clearly identified fior either developed or developing countries. 3- Map is constructed including most of the above steps, population statistics reflect a good level of understanding about either developed or developing countries. Chart demonstrates a good level of understanding population problems, possible solutions and diffiiculties implementing solutions of either developed or developing countries.
Task 2..Answer: 1. Figure 11-24: 1,2,6. 2. Figure 11-26: 1,2 3. Figure 11-27: #1 4. Practice Questions Page 383:2 ,3..