Download
1 / 38
380 likes | 387 Views
LONGEVITY 13 : International Longevity Risk and Capital Markets Solutions Conference 2017. A Bayesian Method for Forecasting Mortality Rates by Health State: with Rising Life Expectancy. Atsuyuki Kogure Keio University, Japan Shinichi Kamiya Nanyang Technological University, Singapore

E N D
LONGEVITY 13:International Longevity Risk and Capital Markets Solutions Conference 2017 A Bayesian Method for Forecasting Mortality Rates by Health State: with Rising Life Expectancy AtsuyukiKogure Keio University, Japan Shinichi Kamiya Nanyang Technological University, Singapore Takahiro Fushimi Stanford University, USA September 21-22, 2017
Aging and mortality forecasting heavy burdens on long-term care cost
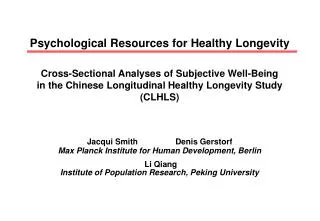
Japan has been and will be agingvery fast ! Population Pyramid of Japan from 1920 to 2050
Mortalityforecasting for total population Death numbers for age x at time t Exposures(populationsizes) for age x at time t Ext Dxt Force of mortality
Subpopulations by health state Death numbers for age x at time tin state j Exposures(subpopulationsizes) for age x at time t in state j Health state 0 (no problem) Dxt0 Ext0 Ext1 Health state 1 (least severe) Dxt1 ... ... ... ExtJ Health state J (most severe) DxtJ
Application: Public Long-term Care Insurance System in Japan
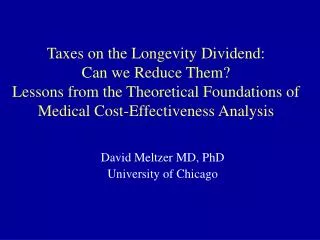
Trends of Persons Certified As Requiring Long-term Care Total number of certified persons in 2015 is 608 (in 10, 000’s) increased by a factor of 2.79 for the past 15 years. total In 10,000’s Care levels Transitional Care levels Support levels 2000 2005 2010 2015 Source: Monthly Report on the Status of Long-term Care Insurance
Posterior distributions forη,γ65,β65,κ2001: male η γ65 κ2001 β65
Changes in posterior means of γx,βx,κtover x or t γx βx κt male
Posterior distributions for η,γ65,β65,κ2001: female η γ65 β65 κ2001
Chanes in posterior means ofγx, βx ,κtover x or t γx βx κt female
Gender difference in health effects male ηj health effect femae j=health state
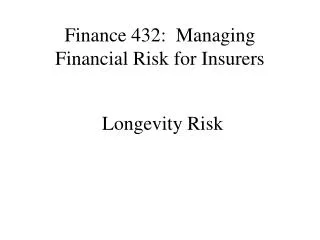
Future mortality rates by health status j=5 j=4 j=3 j=2 j=1 j=0 Male Female
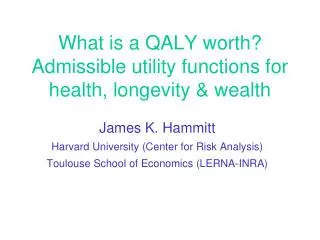
Future survival rates by health status Male Female