Download
1 / 10
100 likes | 353 Views
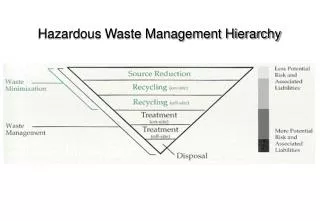
Diagram 1 - Waste Hierarchy. - REDUCTION - REUSE - RECOVERY OF MATERIAL & ENERGY DISPOSAL OF RESIDUE . Diagram 2 - Projected Waste Diversion to 2020 (Biodegradable Municipal Waste). Integrating Best Value and Joint Waste Strategy in Cambridgeshire. Lewis Herbert

E N D
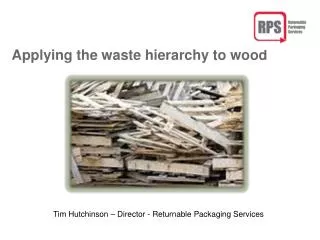
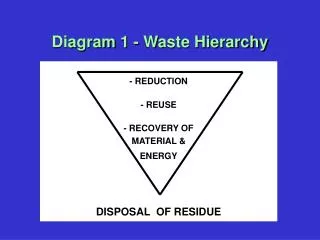
Diagram 1 - Waste Hierarchy - REDUCTION - REUSE - RECOVERY OF MATERIAL & ENERGY DISPOSAL OF RESIDUE
Diagram 2 - Projected Waste Diversion to 2020 (Biodegradable Municipal Waste)
Integrating Best Value and Joint Waste Strategy inCambridgeshire Lewis Herbert Team Leader - Waste Management Cambridgeshire CC 01223 718518
The Other Waste Hierarchy EU Landfill and other Directives Cambridgeshir National strategy, best value and planning guidance Regional planning guidance County joint waste strategy
Joint Waste Strategy Partnership • Cambridgeshire County Council • Peterborough City (unitary) • Cambridge CityEast Cambridgeshire DistrictFenland DistrictHuntingdonshire DistrictSouth Cambridgeshire • Environment Agency