Download
1 / 30
300 likes | 473 Views
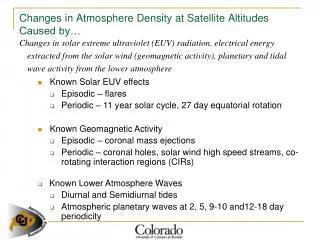
Changes in Atmosphere Density at Satellite Altitudes Caused by…. Changes in solar extreme ultraviolet (EUV) radiation, electrical energy extracted from the solar wind (geomagnetic activity ), planetary and tidal wave activity from the lower atmosphere. Known Solar EUV effects

E N D
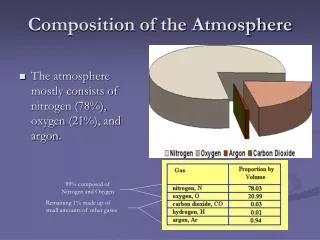
Changes in Atmosphere Density at Satellite Altitudes Caused by… Changes in solar extreme ultraviolet (EUV) radiation, electrical energy extracted from the solar wind (geomagnetic activity), planetary and tidal wave activity from the lower atmosphere • Known Solar EUV effects • Episodic – flares • Periodic – 11 year solar cycle, 27 day equatorial rotation • Known Geomagnetic Activity • Episodic – coronal mass ejections • Periodic – coronal holes, solar wind high speed streams, co-rotating interaction regions (CIRs) • Known Lower Atmosphere Waves • Diurnal and Semidiurnal tides • Atmospheric planetary waves at 2, 5, 9-10 and12-18 day periodicity
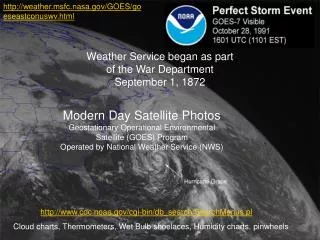
Periodic Coronal Holes and Corotating Interaction Regions in the Interplanetary Medium Yohkoh image-soft X rays
CHAMP Satellite launched in July 2000 at 450 km altitude in a near circular orbit with an inclination of 87.3 and a local time precession of 5.44 min/day (12 hours / 133 days) The physical parameters of the CHAMP satellite are: • Total Mass 522 kg • Height 0.750 m • Length (with 4.044 m Boom) 8.333 m • Width 1.621 m • Area to Mass Ratio 0.00138 m2kg-1 Sutton et al., J. Spacecraft and Rockets, 2007
Periodic Thermosphere Mass Density Perturbations for Year 2005 Density - 400km altitude Solar EUV flux index Day of Year , 2005 Note: Orbit-averaged density with an overall estimated error (systematic and statistical)of less than 10%
Solar Wind and Geomagnetic Activity for Year 2005 Solar wind speed Geomagnetic Activity Index
27 days/3 2005 Periodograms – Subharmonics of a Solar Rotation Density - 400km altitude Solar EUV flux index Solar wind speed Geomagnetic Activity Index
2005 Wavelet Analysis Density - 400km altitude Solar EUV flux index Solar wind speed Geomagnetic Activity Index
9-day Periodicities in Thermosphere Density for days 25-100, 2005 Correlated with Geomagnetic Activity and Felt Globally 9-day Bandpass Filtered Data
2006 Periodograms Solar EUV flux index Lei, J., J. P. Thayer, J. M. Forbes, E. K. Sutton, and R. S. Nerem (2008), Rotating solar coronal holes and periodic modulation of the upper atmosphere, Geophys. Res. Lett., 35, L10109, doi:10.1029/2008GL033875. Thayer, J. P., J. Lei, J. M. Forbes, E. K. Sutton, and R. S. Nerem (2008), Thermospheric density oscillations due to periodic solar wind high-speed streams, J. Geophys. Res., 113, A06307, doi:10.1029/2008JA013190. Solar wind speed Geomagnetic Activity Index Density - 400km altitude Density - 400km altitude
Periodograms of TIMED SEE EUV Datafrom 5-105 nm for 2004 - 2006 5-105 nm Year 2004 Year 2006 Year 2005
TIMED / SABER Measurements of the Daily Infrared Power (W) CO2 Power ( 1011 W) NO 2006 2007 2008 2002 2003 2004 2005
TIMED Measured Power in UV and IR Emissions from 2002-2006 Solar UV Daily TIMED SEE UV measurements from 0-175 nmDaily, Global SABER IR Emissions: Integrated CO2 and NO Power from 100-200km
Periodogram of SABER Measured NO Power from 2002-2006 Mlynczak, M. G., F. J. Martin-Torres, C. J. Mertens, B. T. Marshall, R. E. Thompson, J. U. Kozyra, E. E. Remsberg, L. L. Gordley, J. M. Russell III, and T. Woods (2008), Solar-terrestrial coupling evidenced by periodic behavior in geomagnetic indexes and the infrared energy budget of the thermosphere, Geophys. Res. Lett., 35, L05808, doi:10.1029/2007GL032620.
Periodogram of GUVI Orbit-AveragedSO/N2 ratio for 2005 Crowley, G., A. Reynolds, J. P. Thayer, J. Lei, L.J. Paxton, A.B. Christensen, Y. Zhang, R.R. Meier, D.J. Strickland (2008), Periodic Modulations in Thermospheric Composition by Solar Wind High Speed Streams, Geophys. Res. Lett., 35, L21106, doi:10.1029/2008GL035745. Latitude Coverage +/- 90 degrees Latitude Coverage +/- 60 degrees
Periodogram of Global Total Electron Contentfrom 2005 and 2006 with Latitude Year 2006 Year 2005 2 5 7 9 13 Period (day) 2 5 7 9 13 Period (day) Lei, J., J. P. Thayer, J. M. Forbes, Q. Wu, C. She, W. Wan, W. Wang (2008), Ionosphere response to solar wind high speed streams, , Geophys. Res. Lett., 35, L19105, doi:10.1029/2008GL035208.
F-region Neutral Temperatures and Winds from 2005 and 2006 Show 7 and 9 Periodicities Temperature Recorded Temperatures and Windsfrom FPI data at Resolute Bay Year 2005 Meridional Winds Year 2006 Year 2006
SOHO/EIT 195A image of the Sun – April 9, 2005 Equatorward extensionof the northern polar coronal hole Courtesy of Vic Pizzo, NOAA/SEC and Leslie Mayer, CU/CIRES
Coronal Hole and Solar Wind Speed with Heliolongitude Distribution Solar Wind Speed NSO Date longitude lies in the Sun-earth line Derived CoronalHoles NSO Courtesy of Vic Pizzo, NOAA/SEC and Leslie Mayer, CU/CIRES
CIR Events, Superposed Epoch Analysis (centered April 4, 2005)
Cumulative Density Functions for an epoch analysis of 67 CIR storms from 2003 - 2006 Epoch time (days)
Cumulative Density Functions for an epoch analysis of 67 CIR storms from 2003 - 2006
Upper Atmosphere Episodes of Change at Multi-Day Periodicities Discovery: Recent satellite measurements have discovered episodes of change in the Earth's upper atmosphere at periods near 5, 7 and 9 days that are attributed to recurrent high speed solar wind stream disturbances and coronal hole distributions on the sun. • Thermosphere / Ionosphere Properties: • Thermosphere Mass Density at 400km • NO and CO2 IR emissions from MLT • Columnar O/N2 ratio • Global total electron content • F-region Neutral Temperature and Winds
Solar Coronal Holes Interplanetary Medium High SpeedSolar Wind Streams Geomagnetic Storm Thermosphere Breathing Aurora Global ThermosphereHeating Currents
Discovery Leads to Improvements in Predicting Atmospheric Drag on Satellites Enabling Better Satellite Tracking, Avoidance and Design
Periodogram Analysis ofKp Index 2002-2006 N=3 Subharmonics of amean solar rotation period N=1 N=2 N=4 N=5 N=7
Kp Index Periods for Four Solar Cycles 4.5 day 5.4 day 6.75 day 9 day 13.5 day 27 day
Study Implications • Periodic oscillations in thermosphere / ionosphere properties at sub-harmonics of the solar rotation period (9, 6.75 and 5.4 days) have been discovered and related to solar wind high speed streams and the heliolongitude distribution of coronal holes. • The periodic nature of this connection suggests an element of predictability for these geomagnetic storm events • Little change in EUV flux during these episodes allows for geomagnetically driven affects on the thermosphere and ionosphere to be solely studied and identified.