Download
1 / 51
510 likes | 538 Views
Learn about sampling designs, experimental designs, and bias in statistics. Understand observation vs. experiment, randomized experiments, and data collection strategies for making accurate inferences from samples to populations.

E N D
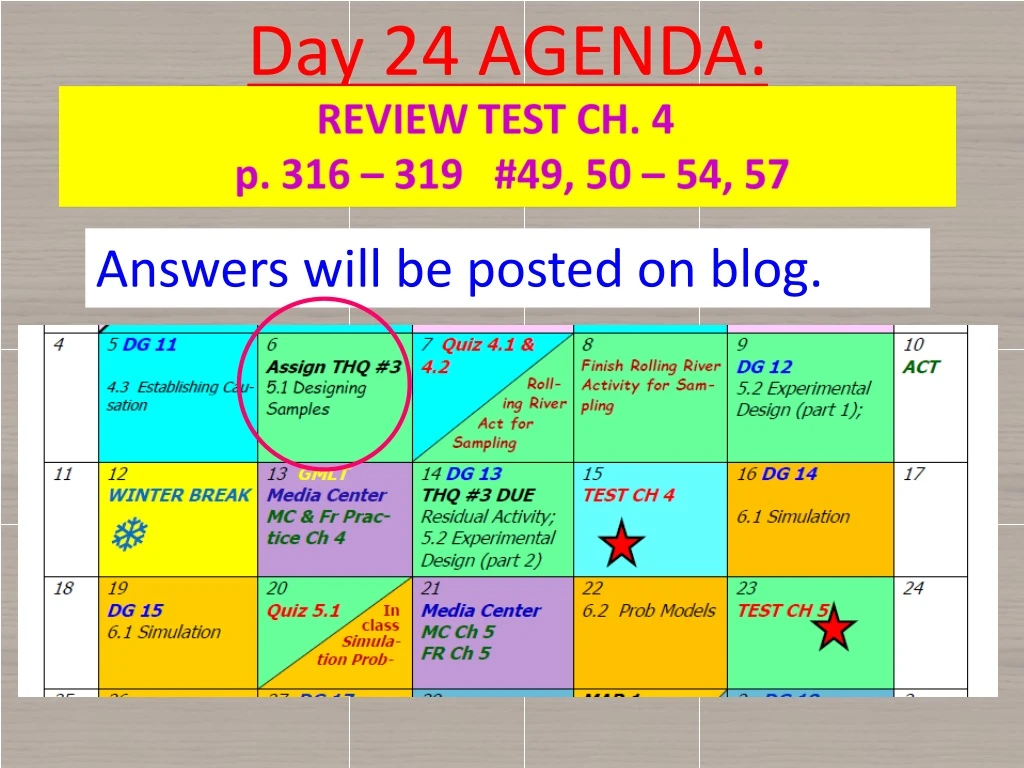
Day 24 AGENDA: Answers will be posted on blog.
AP STATSection 5.1: Designing Samples EQ: What are sampling designs and how can biasoccur in these designs?
Part I: An introduction to experimental design: VIDEO 1 VIDEO 2 VIDEO 3
Population--- all members of a defined group that we are studyingor collecting informationon for data driven decisions.
Sample--- partof the population, a slice of it, and all its characteristics.
Ex . Population vs. Sample A sociologist wants to know the opinions of employed adult women about government funding for day care. She obtains a list of 520 members of a local business and professional women’s club and mails a questionnaire to 100 of these women selected at random. Only 48 questionnaires are returned. What is the population? What is the sample? Population is employed adult women. Sampling Population is 520 members of a local business and professional women’s club. Sample is the 100 women who received the questionnaire.
Observation vs Experiment treatment imposed • no treatment • surveys cause and effect established • when experiment • is not practical
Randomized Experiment --- assignment of treatments controlled by chance: random digit table roll a die flip a coin
Ex. Decide if each of the following is an observation or an experiment. Explain. • 1. You find 100 women age 20 who do not currently smoke. You randomly assign 50 of the 100 women to a group that will smoke a pack of cigarettes a day for 10 years and the remaining 50 women to a group that will remain smoke-free for 10 years. After 10 years, you measure the lung capacity of all 100 women, analyze, interpret, and draw conclusions from your results. Experiment --- treatment (explain ) was imposed
2. You find 100 women age 30 of which 50 have been smoking a pack of cigarettes a day for 10 years while the other 50 have been smoke free for 10 years. You measure the lung capacity of all 100 women, analyze, interpret, and draw conclusions from your results. Observation --- no treatment (explain) was imposed 3. A group of 60 exercisers are classified as “walkers” or “runners”. A longitudinal study (one conducted over time) is conducted to see if there are differences between the groups in terms of their scores on a wellness exam. Observation --- no treatment (explain) was imposed
4. A group of 60 volunteers who do not exercise are randomly assigned a fitness program. One group of 30 is enrolled in a daily walking program and the other group is put into a running program. After a period of time, the two groups are compared based on their scores on a wellness index. Experiment --- treatment (explain ) was imposed
Now you decide whether you think the 3 videos we watched at the beginning of class were observations or experiments. Recycle Bottles Game Trashcan with Noise Piano Stairs
Steps for Planning A Study Step 1: Identify population Step 2: Compile list of subjects in the population from which the sample will be taken This is called the sampling frame.
Step 3: Specify a method for selecting subjects from the sampling frame Step 4: Select subjects, gatherand compile data Step 5: Make inference about population based on statistics
Data Collection Strategies Census --- is the procedure of systematically acquiring and recording information about the members of a given population. It is a regularly occurring and official count of a particular population • Sampling --- study a part to learn about the whole
Sampling Techniques • Good Data • --- select individuals at random without replacement; every possible sampleof size n has the same chance of occurring Simple Random Sample
Bad Data Sampling Techniques --- you choose to participate 1) Voluntary Sampling • --- people chosen based on convenience of contactingthem 2) Convenience Sampling --- organized around categories 3) Quota Sampling
Ex . What type of sampling does each of the following methods represent? 1. The owner of a club with 1,000 members wants to survey 50 members about the friendliness of the staff. He asks the first 50 members who enter the club one morning. Convenience--- surveyor asks first 50 patrons to the club on a given day
2. The owner of a club with 1,000 members wants to survey 50 members about the friendliness of the staff. He leaves a stack of response cards by the sign-in desk asking members to participate. Voluntary--- responders given choice to fill out survey forms
3. The owner of a club with 1,000 members wants to survey 50 members about the friendliness of the staff. He puts each name on a slip of paper then places all of the slips in a hat and mixes them well. He draws one slip out, notes the name, and returns the paper back into the hat. He continues picking and noting the name until 50 different names are selected. SRS --- every sample of club members size n = 1 has an equal chance of being surveyed
Bias --- systematic error, favors certain outcomes • Three Types of BiasWhich Could Occur in Sample Surveys: Population Under Represented in Sample: • Under-coverage--- my group is left out • of the sample; not even considered • 2. Nonresponse--- group is chosen for the sample can't be reached or refuse to participate
Inaccurate Responses Result of: 3. Response Bias--- problems that result from the measurement process; due to wording ofquestion or social desirability (what you think the interviewer wants to hear; particularly if survey notconfidential) • Know Difference Between Bad SamplingTechniques (nonprobability methods) and Type of Bias as a result of these methods.
In Class Assignment for Part 1: • Complete Handout for Samples • Complete Handout for Bias • HW Assignment for Part 1: • p. 333 – 334 #1 - 8 REVIEW TEST CH. 4 p. 316 – 319 #49, 50 – 54, 57
Day 25 Agenda: • Quiz 4.1 & 4.2 --- 30 minutes We are still going to Media Center Tues
Part II: Types of Probability Sampling GOOD Sampling Techniques!! • Random Sampling Schemes: SRS I. Simple Random Sample A. each member of population equally likely to be chosen B. members of the sample are chosen independentlyof one another
Selection Method: • Obtain master list (Sampling Frame) of population:telephone numbers, house addresses, census tracts • b)Assign digits to subjects in Sampling Frame; randomly select a sample of size nusing: • table of random digits • (ii)random number generator
What’s another way you could have numbered these students? • 00 to 19 • When would it be smart to start with 00 instead of 01? • Allows you to read less digits at the time. • Ex 00 to 99 instead of • 001 to 100 • Why would you consider • this a simple random sample? 19 06 09 10 16 01 08 20 Thomas Dixon • Every student (2-digit number) has an equal probability of occurring. Garris Glenn Scott Alex Flynn Young
II. Stratified Random Sample: The researcher divides the entire target population into different subgroups, or strata, and then randomly selects the final subjects proportionally from the different strata.
Common variables to use in defining strata: gender race c) geographic location • NO OVERLAP BETWEEN STRATA • INDIVIDUAL FITS INTO ONLY ONE STRATA.
Advantages of using strata sampling: • natural strata can simplify fieldwork • b) similar behavior patterns within homogenous groups results in reduction on the error of estimation • c) estimates of population parameters may be desired for subgroups
II. Cluster Sampling: Entire population is divided into groups, or clusters, and a random sample of these clusters are selected. All observations in the selected clusters are included in the sample.
Common Cluster Sampling Groups: • household • geographic location • c) city block REMEMBER: The key is you are randomly selecting entire groups.
Advantages of Cluster Sampling: population frame not available or too costly b) cost of observations directly proportional to distance separating the elements
IV. Systematic Sampling: The elements of the population are put into a list and then every kth element in the list is chosen (systematically) for inclusion in the sample.
All Sampling Techniques: Quota Voluntary • Assignment: p. 341 – 342 #10, 11, 13, 14 • Assignment: p. 349 #21, 23, 25, 27, 28, 30
In Class Activity: Rolling Down the River • Form groups of 3 to 5 for this activity. No SINGLETONS! • What your group doesn’t finish in class, you will finish for HW. This is to be turned in tomorrow.
Farmer wants data that best represents the actual yield, not the best yield, for the field. Farmer wants to choose method that will result in least amount of variation.
Farmer chooses plots easiest (closest to his house) to harvest. X X X X X X X X X X 6 2.05 2 5 6.5 7 9 none 60 6 600 IQR = 7 – 5 - 2 Remember to calculate LF and UF to determine outliers. LF: 5 – [(1.5)(2)] = 2 UF: 7 – [(1.5)(2)] = 10
You could read only 2 digits at the time. HOW? Consider digits 00 to 99 instead of 001 to 100. But our field is already numbered so let’s use 001 to 100. NO, can’t harvest plot more than once. Continue until you have selected 10 different plots.
The plots are stratified based on distance from the river. #1 to 10 vertically Yes, a digit represents location in a strata, not in the entire field.
HOW MANY DIGITS DO WE NEED TO LOOK AT TO REPRESENT A PLOT? 1 2 3 4 5 6 7 8 9 10 1 2 3 4 5 6 7 8 9 10 1 2 3 4 5 6 7 8 9 10 Use 00 to 09 The first plot selected will be for the first strata. etc.. Line 145
All distances from river represented in each strata. #1 to 10 horizontally HOW MANY DIGITS DO WE NEED TO LOOK AT TO REPRESENT A PLOT? 1 2 3 4 5 6 7 8 9 10 1 2 3 4 5 6 7 8 9 10 1 2 3 4 5 6 7 8 9 10 Use 00 to 09 etc. The first plot selected will be for the first strata.


