Download

1 / 22
230 likes | 305 Views
Salinity Interpolation in Corpus Christi Bay. Presented by Ernest To May 1, 2007. Corpus Christi Bay Testbed. National Datasets (National HIS). Regional Datasets (Workgroup HIS). USGS. NCDC. TCOON. Dr. Paul Montagna. TCEQ. SERF. NCDC station. TCOON stations. TCEQ stations.

E N D
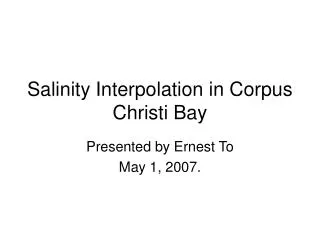
Salinity Interpolation in Corpus Christi Bay Presented by Ernest To May 1, 2007.
Corpus Christi Bay Testbed National Datasets (National HIS) Regional Datasets (Workgroup HIS) USGS NCDC TCOON Dr. Paul Montagna TCEQ SERF NCDC station TCOON stations TCEQ stations Hypoxic Regions Montagna stations USGS gages SERF stations ET 20061116
Port Aransas 1 Ingleside 2 18 12 11 21 10/D 8 34 14 39 30 24 9 Oso Bay Packery Channel Laguna Madre 08/02/2005 Salinity in Corpus Christi Bay
Port Aransas 1 Ingleside 2 18 12 11 21 10/D 8 34 14 39 30 24 9 Oso Bay Packery Channel Laguna Madre 08/16/2005 Salinity in Corpus Christi Bay
Port Aransas 1 Ingleside 2 18 12 11 21 10/D 8 34 14 39 30 24 9 Oso Bay Packery Channel Laguna Madre 08/23/2005 Salinity in Corpus Christi Bay
Port Aransas 1 Ingleside 2 18 12 11 21 10/D 8 34 14 39 30 24 9 Oso Bay Packery Channel Laguna Madre 08/30/2005 Salinity in Corpus Christi Bay
Kriging • Kriging is BLUE (best linear unbiased estimator). • Kriging is a function that predicts value and error estimates by using data values and their spatial configuration as inputs. • Requires: • Stationarity, i.e. mean and variance are invariant with translation • to support covariance modeling • Normality • to support linear estimation • Advanced Kriging methods can deal with non-normality and non-stationarity.
Test for Normality Tests also performed on subsets of the data.
Examples of Variograms(Variograms for salinity data collected on 8/2/2005) Major azimuth = N60E Major range = 15,000 m Sill = 6 Minor azimuth = N150E Minor range = 1800 m Dip angle = 0 Vertical range = 1 m
Process flowchart Probability plots Database Perform normality tests (IDL) Variograms transformation parameters, λ Plot Variograms (IDL) Variogram parameters, e.g. range, sill anisotropy, azimuth, dip, variogram model, etc. Perform 3D kriging (IDL) Gamv.exe (GSLIB) KT3D.exe (GSLIB) Visualize results using voxels (IDL)
Voxels • Voxels = volume pixels or 3D pixels • A voxel volume is formed by superpositioning four 3D arrays: • Red array + Green array + Blue array +Opacity array • Manipulation of the opacity array can make inner voxels visible Plotted with data from head.dat from IDL 6.3 examples
Port Aransas 1 Ingleside 2 18 12 11 21 10/D 8 34 14 39 30 24 9 Oso Bay Packery Channel Laguna Madre 08/02/2005 Kriging Results for Aug 2, 2005.
Port Aransas 1 Ingleside 2 18 12 11 21 10/D 8 34 14 39 30 24 9 Oso Bay Packery Channel Laguna Madre Kriging Results for Aug 16, 2005.
Port Aransas 1 Ingleside 2 18 12 11 21 10/D 8 34 14 39 30 24 9 Oso Bay Packery Channel Laguna Madre Kriging Results for Aug 23, 2005. 08/23/2005
Port Aransas 1 Ingleside 2 18 12 11 21 10/D 8 34 14 39 30 24 9 Oso Bay Packery Channel Laguna Madre 08/30/2005 Kriging Results for Aug 30, 2005.
Space-Time Integration timeline ? ? ? What happened in between the observations?
Conclusion • Created set of tools to investigate data, perform 3D interpolation and visualize results. • Analysis framework can be expanded to 4D and modified to incorporate data from deterministic models. • One step towards understanding space-time integration.
Next steps • Understand factors causing salinity patterns observed in August 2005. • Expand on framework to perform space-time kriging • Incorporate results from salinity models into kriging model using kriging with external drift.