Unveiling Pulsars: Analyzing GBT Data in 2007
Join Team Taylor as they delve into the world of pulsar research using data from the Green Bank Telescope. Learn about pulsars, RFI, and noise, and explore the fascinating results of their observations. Discover the intricacies of prep-fold plots and the insights they provide in pulsar studies.

Unveiling Pulsars: Analyzing GBT Data in 2007
E N D
Presentation Transcript
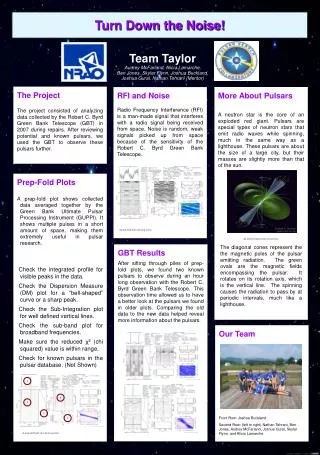
Turn Down the Noise! Team Taylor Audrey McFarland, Alicia Lamarche, Ben Jones, Skylar Flynn, Joshua Buckland, Joshua Gural, Nathan Tehrani (Mentor) The Project The project consisted of analyzing data collected by the Robert C. Byrd Green Bank Telescope (GBT) in 2007 during repairs. After reviewing potential and known pulsars, we used the GBT to observe these pulsars further. More About Pulsars A neutron star is the core of an exploded red giant. Pulsars are special types of neutron stars that emit radio waves while spinning, much in the same way as a lighthouse. These pulsars are about the size of a large city, but their masses are slightly more than that of the sun. RFI and Noise Radio Frequency Interference (RFI) is a man-made signal that interferes with a radio signal being received from space. Noise is random, weak signals picked up from space because of the sensitivity of the Robert C. Byrd Green Bank Telescope. Prep-Fold Plots A prep-fold plot shows collected data averaged together by the Green Bank Ultimate Pulsar Processing Instrument (GUPPI). It shows multiple pulses in a short amount of space, making them extremely useful in pulsar research. Check the integrated profile for visible peaks in the data. Check the Dispersion Measure (DM) plot for a “bell-shaped” curve or a sharp peak. Check the Sub-Integration plot for well defined vertical lines. Check the sub-band plot for broadband frequencies. Make sure the reduced χ² (chi squared) value is within range. Check for known pulsars in the pulsar database. (Not Shown) A prep-fold plot showing noise. An artist’s impression of a pulsar. The diagonal cones represent the the magnetic poles of the pulsar emitting radiation. The green ovals are the magnetic fields encompassing the pulsar. It rotates on its rotation axis, which is the vertical line. The spinning causes the radiation to pass by at periodic intervals, much like a lighthouse. GBT Results After sifting through piles of prep-fold plots, we found two known pulsars to observe during an hour long observation with the Robert C. Byrd Green Bank Telescope. This observation time allowed us to have a better look at the pulsars we found in older plots. Comparing the old data to the new data helped reveal more information about the pulsars. Our Team Front Row: Joshua Buckland Second Row: (left to right) Nathan Tehrani, Ben Jones, Audrey McFarland, Joshua Gural, Skylar Flynn, and Alicia Lamarche 1 4 3 5 2 A prep-fold plot of a known pulsar.