Download

1 / 39
390 likes | 404 Views
Experimental Research Designs. Note: Bring measurement plan. In small groups. Read each others measurement plans How is/are the IV(s) measured? How is/are the DV(s) measured? How do the variables vary? Has the writer addressed reliability? How? Has the writer addressed validity? How?.

E N D
Experimental Research Designs Note: Bring measurement plan
In small groups • Read each others measurement plans • How is/are the IV(s) measured? • How is/are the DV(s) measured? • How do the variables vary? • Has the writer addressed reliability? • How? • Has the writer addressed validity? • How?
Experimental Research • Can demonstrate cause-and-effect very convincingly • Very stringent research design requirements • Experimental design requires: • Random assignment to groups (experimental and control) • Independent treatment variable that can be applied to the experimental group • Dependent variable that can be measured in all groups
Quasi-Experimental Research • Used in place of experimental research when random assignment to groups is not feasible • Otherwise, very similar to true experimental research
Causal-Comparative Research • Explores the possibility of cause-and-effect relationships when experimental and quasi-experimental approaches are not feasible • Used when manipulation of the independent variable is not ethical or is not possible
Threats to External Validity • External validity—extent to which the results can be generalized to other groups or settings • Population validity—degree of similarity among sample used, population from which it came, and target population • Ecological validity—physical or emotional situation or setting that may have been unique to the experiment • If the treatment effects can be obtained only under a limited set of conditions or only by the original researcher the findings have low ecological validity.
Threats to Internal Validity • Internal validity—extent to which differences on the dependent variable are a direct result of the manipulation of the independent variable • History—when factors other than treatment can exert influence over the results; problematic over time • Maturation—when changes occur in dependent variable that may be due to natural developmental changes; problematic over time • Testing—also known as “pretest sensitization”; pretest may give clues to treatment or posttest and may result in improved posttest scores • Instrumentation – Nature of outcome measure has changed.
Threats to Internal Validity (cont’d.) • Regression – Tendency of extreme scores to be nearer to the mean at retest • Implementation-A group treated in an unintentional differential manner. • Attitude-Hawthorne effect, compensatory rivalry. • Differential selection of participants—participants are not selected/assigned randomly • Attrition (mortality)—loss of participants • Experimental treatment diffusion – Control conditions receive experimental treatment.
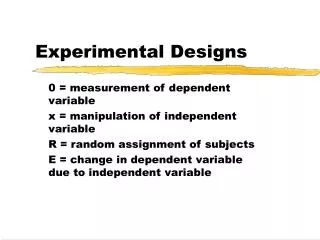
Experimental and Quasi-Experimental Research Designs • Commonly used experimental design notation : • X1 = treatment group • X2 = control/comparison group • O = observation (pretest, posttest, etc.) • R = random assignment
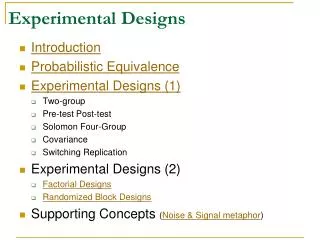
Common Experimental Designs • Single-group pretest-treatment-posttest design: O X O • Technically, a pre-experimental design (only one group; therefore, no random assignment exists) • Overall, a weak design • Why?
Common Experimental Designs (cont’d.) • Two-group treatment-posttest-only design: R X1 O R X2 O • Here, we have random assignment to experimental, control groups • A better design, but still weak—cannot be sure that groups were equivalent to begin with
Common Experimental Designs (cont’d.) • Two-group pretest-treatment-posttest design: R O X1 O R O X2 O • A substantially improved design—previously identified errors have been reduced
Common Experimental Designs (cont’d.) • Solomon four-group design: R O X1 O R O X2 O R X1 O R X2 O • A much improved design—how?? • One serious drawback—requires twice as many participants
Common Experimental Designs (cont’d.) • Factorial designs: R O X1g1 O R O X2g1 O R O X1g2 O R O X2g2 O • Incorporates two or more factors • Enables researcher to detect differential differences (effects apparent only on certain combinations of levels of independent variables)
Common Experimental Designs (cont’d.) • Single-participant measurement-treatment-measurement designs: O O O | X O X O | O O O • Purpose is to monitor effects on one subject • Results can be generalized only with great caution
Common Quasi-Experimental Designs • Posttest-only design with nonequivalent groups: X1 O X2 O • Uses two groups from same population • Questions must be addressed regarding equivalency of groups prior to introduction of treatment
Common Quasi-Experimental Designs (cont’d.) • Pretest-posttest design with nonequivalent groups: O X1 O O X2 O • A stronger design—pretest may be used to establish group equivalency
Similarities Between Experimental and Quasi-Experimental Research • Cause-and-effect relationship is hypothesized • Participants are randomly assigned (experimental) or nonrandomly assigned (quasi-experimental) • Application of an experimental treatment by researcher • Following the treatment, all participants are measured on the dependent variable • Data are usually quantitative and analyzed by looking for significant differences on the dependent variable
Designing High-Quality Research in Special Education: Group Experimental Design (Gersten, Baker, & Lloyd, 2000) • Major recommendations for defining and operationalizing the instructional approach • Avoid the “nominal fallacy” by carefully labeling and describing the independent variables • Search for unanticipated effects that may be produced by the intervention • Address assessment of implementation using standard checklists and in-depth methods • Carefully document what happens in comparison classrooms
Recommendations for probing the nature of the independent variable • Provide a thorough description of samples • Strive for random assignment • Explore other alternative designs, such as formative or design experiments • Quasi-experiments need to be critically reviewed • Pretest variables should not show large differences (.5sd) • Thorough sample description and analysis of comparison groups is essential.
Recommendations regarding the use of dependent measures • Select some measures that are not aligned tightly to the intervention • Ensure that all measures are not experimenter developed and that some have been validated in prior research. • Seek a balance between global and specific measures • Look at intervention research as an opportunity to really build understanding of measures
The importance of replication • Researchers not interested in development of the independent variable should be involved • Why?
Study #1 • What information does the public want from a School Report Card? (Adapted from Osowski)
???? ???? ???? Public rates one report ???? ???? card format higher than another. ???? ???? ????
Study #2 • Does dual language instruction result in academic achievement?
???? ???? ???? DL students outscore BE ???? students who outscore ???? EO students ???? ???? ????
Inferential Statistics Chapter Eleven
What are Inferential Statistics? • Refer to certain procedures that allow researchers to make inferences about a population based on data obtained from a sample. • Obtaining a random sample is desirable since it ensures that this sample is representative of a larger population. • The better a sample represents a population, the more researchers will be able to make inferences. • Making inferences about populations is what Inferential Statistics are all about.
Sampling Error • It is reasonable to assume that each sample will give you a fairly accurate picture of its population. • However, samples are not likely to be identical to their parent populations. • This difference between a sample and its population is known as Sampling Error. • Furthermore, no two samples will be identical in all their characteristics.
Distribution of Sample Means • There are times where large collections of random samples do pattern themselves in ways that will allow researchers to predict accurately some characteristics of the population from which the sample was taken. • A sampling distribution of means is a frequency distribution resulting from plotting the means of a very large number of samples from the same population
Standard Error of the Mean • The standard deviation of a sampling distribution of means is called the Standard Error of the Mean (SEM). • If you can accurately estimate the mean and the standard deviation of the sampling distribution, you can determine whether it is likely or not that a particular sample mean could be obtained from the population. • To estimate the SEM, divide the SD of the sample by the square root of the sample size minus one.
Confidence Intervals • A Confidence Interval is a region extending both above and below a sample statistic within which a population parameter may be said to fall with a specified probability of being wrong. • SEM’s can be used to determine boundaries or limits, within which the population mean lies. • If a confidence interval is 95%, there would be a ‘probability’ that 5 out of 100 (population mean) would fall outside the boundaries or limits.