Download
1 / 74
760 likes | 893 Views
India, the second most populous country, faces demographic challenges with a rapidly growing population. The Family Planning Division under the Ministry of Health & Family Welfare leads efforts to manage population growth through demographic transition. The program aims to reduce the Total Fertility Rate (TFR) to 2.1 by 2021, focusing on improving maternal and child health outcomes. By addressing high-risk births and unmet contraceptive needs, the initiative strives to lower the Infant Mortality Rate (IMR) and Maternal Mortality Ratio (MMR). Population projections and TFR goals guide the implementation to achieve sustainable demographic balance. The initiative targets states with slow fertility transition, emphasizing the importance of family planning services in reducing child and maternal mortality.

E N D
FAMILY PLANNING PROGRAM FAMILY PLANNING DIVISION Ministry of Health & Family Welfare Government of India
DEMOGRAPHIC SCENARIO India is the second most populous country in the world. India has 17 % of world’s population and has less than 3% of earth’s land area. While the global population has increased 3 times, India has increased its population 5 times during the last century. India’s population is expected to exceed that of China before 2030 to become the most populous country in the world.
DEMOGRAPHIC TRANSITION 1. India is in the middle of demographic transition. 2. Both fertility and mortality are declining, (the pace and magnitude of the decline varies across the States.) 3. Reasons for high growth rate are.: • Large size of population in the reproductive age group • High fertility due to unmet needs for contraception • High intended fertility due to high IMR
Performance of Family Welfare Programme Indicators Past level Current level Crude Birth Rate (per thousand population) 40.8 (1951) 23.5 (2006) Crude Death Rate (per thousand population) 25.1 (1951) 7.5 (2006) Infant Mortality Rate (per thousand) LIVE births) 146 (1951-61) 57 (2006) Maternal Mortality Ratio (per 100000 live births) 437 (1992-93) 301 (2001-03) Total Fertility Rate (per woman) 6.0 (1951) 2.8 (2006) Life Expectancy at Birth (in years) Male Female 1951: 37.1 36.1 (2001) 63.87 66.91
GOALS AND CURRENT STATUS Indicator Current Level 10th Plan 2007 2010 goals as per NPP Infant Mortality Rate (per 1000 live births) 58 (SRS) 57 (NFHS-III) 45 30 Maternal Mortality Rate (per 100,000 live births) 301 (SRS) 200 100 Total Fertility Rate 2.87 (SRS) 2.7 (NFHS-III) 2.3 2.1
PROJECTED TOTAL POPULATION AS ON 1st MARCH 2001-2026 (IN MILLION) STATES 2001 2006 2011 2016 2021 2026 Rajasthan 57 62 68 73 78 82 Uttar Pradesh 166 183 201 218 235 249 Bihar 83 91 98 104 109 114 MP 60 66 72 78 83 88 India 1029 1112 1193 1269 1340 1400
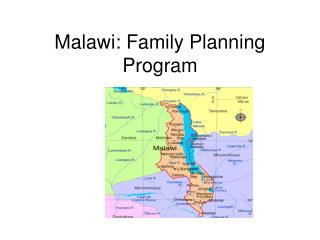
POPULATION PROJECTION India’s population is expected to reach 1.40 billion by 2026 All India Total fertility rate is expected to reach replacement level by 2021 The slow pace of fertility transition in UP, Bihar, MP, Rajasthan, Jharkhand, and Chhattisgarh is a cause for concern.
Age Composition • Population under 15 years (currently 35%) is projected to decline to 23% by 2026 • The age group 15-59 years (currently 58%) is projected to increase to 64% by 2026 • Elder persons (age 60 and above) 7% of population in 2001 is projected to increase to 12% of population in 2026
WHAT IS TFR • The total fertility rate is the average number of children a woman would have if she were to pass through her reproductive years bearing children at the same rates as the women now in each age group. • It is computed by summing the age specific fertility rates for all ages. • It gives a magnitude of completed family size In simple terms TFR denotes the average number of children borne per woman
PROJECTED LEVELS OF TFR, INDIA, 2001-2025 Year/Period Unweighted Estimates Weighted Estimates 3.2 SRS 2000 2.82 2001-2005 2.90 2.48 2006-2010 2.60 2.21 2011-2015 2.35 2.01 2016-2020 2.17 2021-2025 1.89 2.02
YEAR BY WHICH TFR OF 2.1 WILL BE ACHIEVED 1 Andhra Pradesh Achieved in 2005 2 Assam 2019 3 Bihar 2021 4 Chhattisgarh 2022 5 Delhi Achieved in 2001 6 Gujarat 2012 7 Haryana 2012 8 Himachal Pradesh Achieved in 2002 9 Jammu & Kashmir - 10 Jharkhand 2018 11 Karnataka Achieved in 2006 12 Kerala Achieved in 1988 13 Madhya Pradesh 2025 14 Maharashtra Achieved in 2006 15 Orissa 2010 16 Punjab Achieved in 2005 17 Rajasthan 2021 18 Uttar Pradesh 2027 19 Uttaranchal 2022 20 Tamil Nadu Achieved in 2000 21 West Bengal Achieved in 2005 22 North-East (Excl. Assam) 2025 India 2015 India (Weighted) 2021
Achieving the Fertility Goals Help Reduce Child and Maternal Mortality • Today there are many high risk births • High-risk births lead to high child mortality
Reasons for high infant & child mortality • Short birth intervals • A child born within 1½ yrs. of the previous sibling will have 3 times the chance of dying than after a 3 yr. interval • Leads to malnutrition in children, • Leads to 50% of child deaths. • Unwanted children are more likely to die than wanted ones (ref. UNFPA) and • 75% pregnancies are unplanned and • 25% are unwanted in our country (NFHS)
High-Risk Births Also Contribute to High MMR In Bangladesh MMR is higher for higher order births … Source: Chen et al. Maternal Mortality in Rural Bangladesh Studies in Family Planning 5:11;334-341.
High-Risk Births Also Contribute to High MMR … and higher for older mothers. Source: Chen et al. Maternal Mortality in Rural Bangladesh Studies in Family Planning 5:11;334-341.
Achieving the TFR goal will reduce the percent of high-risk births … High-risk births are those that are spaced less than 2 years apart, or where the mother is under 20, over 30 or already has 3 children.
Achieving the TFR goal will reduce the percent of high-risk births … • High fertility • strongly increases a woman’s life time risk of dying from pregnancy related causes. • Reductions in TFR • reduce the number and proportion of high-risk births
Means of reducing TFR • 25% increase in breastfeeding duration • would reduce TFR by 11%. (ref. UN-ACC/SCN) • Accessible and effective family planning services • reduce maternal deaths by 35% by simply preventing unintended babies being born ( ref. DFID.)
In a single generation Thai fertility moved fromhigh to low levels
In a single generation Thailand emerged as a middle-income country Source: World Bank Development Indicators.
Greater emphasis on the quality of the population rather than sheer numbers More and better educational opportunities More investment in modern agriculture Higher levels of savings and investment with lower dependency ratios Declining fertility was a key factor in the Asian economic “miracle” . . . Source: Population Matters: Demographic Change, Economic Growth, and Poverty in the Developing World.
Benefits of family planning • Stabilises population • Reducesmaternal mortality • Reduces infant and child mortality
Benefits of family planning • Frees scarce and vital resources for equitable distribution among the people • Leads to economic upliftment of the people • Improves the quality of life • Leads to all-round progress of the state and the country as a whole
Slower rates of population growth benefit all aspects of development Health Education Agriculture Population Economy Environment Urbanisation
National Population Policy, 2000 • IMMEDIATE OBJECTIVE Address the unmet needs of contraception, Reproductive and Child Health care • MEDIUM TERM OBJECTIVE Achieve Replacement Level Fertility by 2010 • LONG TERM OBJECTIVE Bring about population stabilisation by 2045
WHERE WE STAND NPP 2000 and the present scenario: • 2010 Population replacement (put back now to 2021) • 2045 Population Stabilization (put back now to 2060 (1.53 billion in 2060). • EAG states constitute 42% of the population (TFR between 3.4 and 4.3)
NATIONAL RURAL HEALTH MISSION • The Government has launched NRHM that includes the second phase of Reproductive and Child Health (RCH) program. • Population stabilization is one of the objectives of NRHM. • NRHM seeks to provide effective health care through improved access to quality health care services to rural population • NRHM provides a thrust for reduction of child and maternal mortality and fertility rate.
AREAS OF CONCERN IN FP ( Socio cultural factors) Large unmet needs for contraception Poor quality of family planning services Inadequate attention on spacing methods Low male participation Low age at marriage for girls Low age at bearing Children Low spacing between pregnancies Frequent pregnancies Strong preference for son Low proportion of safe deliveries Low female literacy/women empowerment
Areas of concern in FP (Programmatic weakness) • Poor Access to FP services • Fixed day regular services unavailable at sub district level • 24/7 PHC & FRUs not providing sterilisation services • Poor Manpower development at state level • No effort to increase manpower for minilap and lap. • Underutilization of trained NSV providers • Lack ofContraceptive updates at state/district • Lack ofConcerted BCC strategy for FP • Achieve ELA in the last quarter • Pressure on the system where quality is a casualty • PPP in FP not evident • Non accreditation of private providers at state/distr.
Major reasons assigned for falling performance • Supreme court’s order of 2005 on qualification norms of doctors performing sterilisation • Lack of laparoscopes (40% of sterilisations done are Lap. St.) (both the above does not explain fall in IUDs) • Target free approach introduced in 1996-97 • Reduced thrust on FP in RCH II
GOI POLICY(Servicing the unmet need) • Based on felt needs of the community • TARGET FREE • Children by choice & not chance • Equal emphasis on both limiting and spacing methods • ELA :Scientific and statistically significant way being formulated for calculating state wise performance level based on unmet need Population stabilization is a priority area of the GOI
MEETING UNMET NEEDS 1 Two third Indians want to use contraception 2 There is no scope for coercion 3 Ensure availability of quality RH services 4 Meet the felt needs of couple 5 Enable couple to achieve their RH goals
New Interventions in Family Planning (GOI) • Addressing the unmet need in contraception through • Assured delivery of family planning services • Developing skilled manpower for the same • Increasing male participation through intensive promotion of NSV • Promotion of IUDs as a short & long term spacing method • Promotion of Emergency Contraceptive Pills • Ensuring quality care in FP services • Promoting Public Private Partnerships • Revised compensation scheme • Family planning insurance scheme • Increasing basket of choices • Promoting contraception through increased advocacy
Temporary (Spacing) Methods • IUD 380 A • EC Pills • OC Pills • CC ( dual purpose condoms)
A. Augmenting trained service providers in IUD: (Alternative training strategy in IUD in 12 pilot states) 5 Master trainers each trained at NIHFW for all the 12 states All 12 states completed their state level master trainers’ TOT 6 states have gone in for district level training Feedback extremely positive Plan for pilot to be extended to all states has been approved B. Introducing Social Marketing/ Social Franchising in IUD being piloted in 3 states- Rajasthan, Gujarat, Bihar (in final stages) Reduce unmet need in Spacing method (Increasing access and uptake of IUD 380A)
Reduce unmet need in Spacing (advantages of IUD 380 A) • 10 years’ duration & not 3 years • Can cover reproductive life span in 2 insertions only (25- 45 yrs.) • Can potentially replace the sterilization procedures • Can be inserted at subcentre level • ANM/ MOs could be given refresher training
Promotion of EC Pills • 2 tabs of 0.75mg or 1 tab of 1.5mg within 72 hrs of intercourse in the following situations: • Unprotected intercourse • Unplanned intercourse • Failed CC (Nirodh- torn) • Assault/ rape • Levonorgesterol only • No side effect • One time activity to replace MTP • Reduces Maternal Mortality by 10-15%
1. Dissemination through Contraceptive Updates for all states 2. Allowing advertisement by private sector – Relaxation of Drugs & Magical Remedies Act on case by case basis allowed by DCGI Promotion of Emergency Contraception (Increasing awareness, supply and use of ECPs)
Assuring service provision through Fixed day service round the year Periodic camps Augmenting trained manpower in NSV Minilap Lap. Ster. Reducing unmet need in Terminal method
Male participation(Why No Scalpel Vasectomy- NSV ?) • Attain population stabilization in a short period • Shifting responsibility of family planning from females to males
Why NSV ? 6 Ss:- (advantages) • Scalpel less • Stitch less • Safe • Sound • Simple • Short