Download
1 / 49
490 likes | 594 Views
Comprehensive analysis of New England's interstate pipeline delivery capability for power generation needs, addressing projected demand increases and potential constraints. Results, recommendations, and timeline of study supplied.

E N D
Steady-State Analysis of New England’s Interstate Pipeline Delivery Capability Presentation to the NEPOOL Reliability Committee Levitan & Associates, Inc. January 16, 2001
Levitan & Associates, Inc. (LAI) Practice Areas • Energy Markets Simulation and Optimization Modeling • Merchant Generation Economics • Pipeline Transportation Management • Fuel Supply Procurement • Power System Engineering/Heat Balance Optimization • ISO Interconnection Policy and Pricing • NUG Contract Administration (Reformation and Buyouts) • Environmental Compliance Strategy • Litigation Support
Confidentiality • ISO-NE & LAI have and will continue to comply with the NEPOOL Information Policy - Rev 3, dated August 10, 2000 • Proprietary Information kept Confidential • Steady-State hydraulic model developed from interstate pipeline public domain information • FERC 567 Reports & FERC Flow Diagrams Reflecting Peak Day Design
Steady-State Analysis of New England’s Interstate Pipeline Delivery Capability • What the Study Is & Is Not • Individual & Consolidated Models • Steady-State Perspective • No Temporal & Force Majeure
Why a Gas Study ? • In 1991, formation of the New England Gas/Electric Discussion Group to examine regional coordination issues between the gas & electric industries • Three objectives of the “Discussion” Group: • to examine the operational reliability of the gas/electric infrastructure • to increase coordination between the industries • to educate industry participants and observers • Analysis includes the modeling of the loss of a major gas & non-gas fired generator, under projected 1995 system conditions • Seven years go by - no similar analysis has been performed since the publication of that EPRI report
Purpose of Study • Since 1997, ISO-NE has received applications for interconnection System Impact Studies for almost 40,000 MW of new merchant generation capacity • Virtually all of this newly proposed capacity is advanced combined cycle technology or peaking capacity fueled exclusively by natural gas • There is a need to review the natural gas pipeline infrastructure in New England and its ability to reliably meet the increasing demand of the power generation sector (deliverability study)
Scope of Study • Study time frame: 2000 - 2005 • Analysis of existing pipeline infrastructure • Analysis of expected pipeline infrastructure additions • Develop a steady state hydraulic engineering model of the pipeline systems serving the NEPOOL region • Analyze impacts of Reference and High Case natural gas demand consumption • Conduct sensitivity analysis and recommend transient analysis (Phase II of the Study) to be conducted in 2001 • Summarize results and issue report of findings
Timeline of Developments • Summer of 1999, ISO-NE and NEPOOL MRPC discuss the initiation of a Gas Study Project • Fall of 1999, ISO-NE looks to retain a consultant who can provide technical assistance in the development of the RFP • Four potential Consultants were identified: • Energy Market Decisions (EMDEC) • Supply Planning Associates (SPA) • National Economic Research Associates (NERA) • Tabors, Caramanis & Associates (TCA) • EMDEC chosen to develop the RFP - Mr. John Meeske
Timeline of Developments (cont’d) • During the winter 2000, ISO & EMDEC work to develop a Gas Study RFP • RFP Issued March 9th, 2000 - Sent to 25 vendors • Eight vendors respond to the ISO’s RFP • On-site presentations of proposals by select bidders - narrowed down the “Short-List” to three vendors: • Levitan & Associates (LAI) • Energy Ventures Analysis (EVA) • R.W. Beck • Levitan & Associates was chosen as final vendor • Negotiations with LAI continue into early summer to refine the Scope of Work and agree upon costs
Contractual Deliverables • Bi-weekly status reports • Draft report of findings to be issued by December 31, 2000 • Final report of findings to be issued by January 31, 2001 • Steady state database model which runs under the Gregg Engineering WinFlowTM application
Steady-State Modeling Results • No pipeline delivery constraints on a peak day in Winter 2000-01 • No summer peak day pipeline deliverability constraints through 2005 • Delivery constraints are apparent in Winter 2003 • Shortfall in gas requirements 1,755 MW out of 7,550 MW assumed • Delivery constraints intensify by Winter 2005 • Shortfall in gas requirements 3,226 MW out of 11,500 MW assumed • Theoretical mitigation potential thru back-up fuel: Winter 2003 - 71 gas-fired units totaling 16,000 MW - 51 of which are dual fueled totaling 9,250 MW Winter 2005 - 75 gas-fired units totaling 18,650 MW - 54 of which are dual fueled totaling 11,500 MW
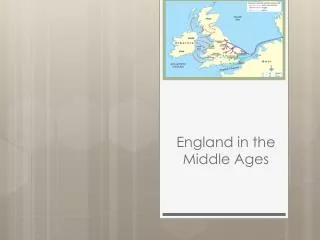
New England Natural Gas Infrastructure • New England’s Major Interstate Pipelines • Iroquois • Portland • Algonquin • Maritimes & Northeast • Tennessee • Existing pipeline delivery capacity = 3.6 Bcf/d. • Daily LNG sendout capability at Everett = 0.450 Bcf/d. • Expansion of 0.60 Bcf/d for 1,550 MW Sithe New Mystic Station, possibly Island End • About 1.4 Bcf/d peak day deliverability behind the citygates • Liquids via truck 100 MMcf/d (0.1 Bcf/d)
Western Canadian Gas thru TCPL, Iroquois and PNGTS M&N Eastern Canadian Gas thru M&N PNGTS Tennessee Western Canadian Gas thru Tennessee Iroquois LNG from Algeria and Trinidad Algonquin Gulf Coast Gas thru Algonquin And Tennessee New England’s Interstate Pipelines
Interstate Transportation Market Dynamics • 14 pipeline projects placed in-service during 1999-’00 + 2.0 Bcf/d in the Greater Northeast • New Pipelines in New England, M&N and PNGTS, result in + 615 MMcf/d (0.615 Bcf/d), or about 3800 MW • Counterflow capability through Dracut Tennessee • Pressure and flow benefits improve network reliability • New LNG supplies from Trinidad • Commoditization of the “Supply Chain” • Repackaged Btu services • Synthetics • Increased liquidity • Risk management
Reference Case High Case Annual Net Energy Growth Rate 1.5% 2.4% Summer Peak Demand Growth Rate 1.7% 2.9% Winter Peak Demand Growth Rate 1.6% 2.5% Capacity Additions 7,551 11,579 Steady-State Demand Assumptions Two Gas Demand Cases developed by ISO-NE & LAI: Reference Case & High Case
Electric Assumptions • ISO-NE develops electric side assumptions • PROSYM production simulation model • Analysis performed for 2000 - 2005 • ISO-NE assumptions for: • projected NEPOOL loads, • existing & proposed capacity and capacity attrition • net-interchange with New York, New Brunswick and Hydro-Quebec • ISO-NE delivers hourly gas demands for NEPOOL units for peak day (summer/winter) and 60 day winter average (Dec 15th thru Feb 15th)
Electric Assumptions - Reference Case • Reference case load growth forecast thru 2005 • 7,500 MW (winter) of new capacity by 2005 • 200 MW of capacity attrition - 2000 CELT Report • Net Interchange: • firm contracts per 2000 CELT Report - (NY, NB, HQ) • modeling of post-HQ FEC deliveries - (HQ Phase II) • modeling of NEPOOL sales via proposed new interconnections (cross-sound cable)
Electric Assumptions - High Case • High case load growth forecast thru 2005 • 11,500 MW (winter) of new capacity by 2005 • 4,000 MW (winter) of capacity attrition • Net Interchange - Higher than Reference case: • firm contracts per 2000 CELT Report - (NY, NB, HQ) • modeling of post-HQ FEC deliveries - (HQ Phase II) • modeling of NEPOOL sales via proposed new interconnections (cross-sound cable & Bridgeport cable)
Monthly Gas Send-Out in New England Source: NEGA, 2000 Statistical Guide, March 2000
LNG/Propane Storage Withdrawals Pipeline Storage Injections Typical New England LDC Daily Gas Send-Out Source: WEFA, Northeast Natural Gas Markets, Opportunities and Risks, November 1998
Load Profiles and Seasonality • Winter • Reliance on Peak Day System Flow diagrams from various certificate applications to serve merchant generators • Summer • Statistical inference from LDCs’ normalized sales
Gregg’s WinFlow Steady-State Model • WinFlow is a shell, requiring extensive and elaborate customization • WinFlow calculates the balanced steady-state pressure-flow relationships for pipeline networks
Validation of Steady-State Models • Each individual interstate pipeline model matched its Peak Day Flow diagram within industry tolerances • 5# psi • 10 hp • Steady-state models for Algonquin, Tennessee and M&N were reviewed and informally validated with individual pipelines
Scheduling Priorities during Constraints • Primary Firm Transportation LDCs, to a lesser extent, QFs and some merchants • Secondary Firm Transportation (quasi-firm) Marketers and merchant generators • Interruptible Transportation Industrials, merchant generators
* 6970 Btu/kWh 2001 2003 2005 Projected Shortfalls in Gas Requirements (MW)*
Summary of Peak Day Gas Scenarios – Total Regional Demand vs. System Capacity
Steady-State Modeling Results Unserved merchant capacity does not take into account back-up fuel capabilities.
Back-up Fuel Issues • Infrastructure • Air Permits • Delivery Logistics • Tankage • Refill • Operational Constraints, e.g. switch-on-the-fly • Sustainability
Electrical Contingency: Loss of Major Gas-Fired Generating Unit • No significant loss of pressure or flows • Interstate pipelines have the ability to divert and/or re-route gas along the 1100-mile transportation path
Electrical Contingency: Loss of 2000 MW Hydro-Quebec Phase II Facility • Winter Peak Day (after winter 00/01) - System cannot transport any additional gas • Summer Peak Day - More than sufficient pipeline capacity to support replacement gas fueled generation
Gas Contingency 1 • Increased horsepower requirements at other compressor stations • Fall in delivery pressures to levels that could disrupt plant operations • No observed impact on other pipelines • Available compression capacity at Burrillville on Algonquin derated from 11,400 hp to 5,700 hp
Gas Contingency 2 • Downstream compressor stations able to make-up for loss • No unacceptably low delivery pressures for merchant plants observed • No impact on other pipelines • Available compression capacity at Agawam on Tennessee derated from 9,760 hp to 3,253 hp
Gas Contingency 3 • Downstream compressors able to compensate for pressure loss • 7 miles of Tennessee’s 36-inch line at NY-MA border removed
Recommendations • Certify quality of interstate transportation arrangements • Increase understanding of merchant generators’ fuel-switching capabilities • Promote coordination of power and natural gas scheduling protocols • Advocate the streamlining of FERC’s pipeline certification process
LAI Project Team • John Pitts Senior Consultant • John Mesko, P.E. Senior Consultant • Lilly Zhu Consultant • Shilpa Shah Assistant Consultant • Richard Levitan President • John Bitler Principal • Edward McGee, P.E. Managing Consultant • Jack Elder, P.E. Manager, Power Systems and Technology
Levitan & Associates, Inc.www.levitan.comTel: 617-531-2818Email: rll@levitan.com