

SEQUENCE DATABASE
E N D
Presentation Transcript
SEQUENCE DATABASE M.Prasad Naidu MSc Medical Biochemistry, Ph.D,.
There are unique requirements for implementing algorithms for sequence database • searching. • The first criterion is SENSITIVITY, which refers to the ability to find as many correct hitsas possible. • The second criterion is SELECTIVITY, also called SPECIFICITY, which refers to the ability to exclude incorrect hits. • These incorrect hits are unrelated sequences mistakenly identified in database searching and are considered “false positives.” • The third criterion is SPEED, which is the time it takes to get results from data base searches. • Depending on the size of the database, speed sometimes can be a primary concern.
An increase in sensitivity is associated with decrease in selectivity. • An improvement in speed often comes at the cost of lowered sensitivity and selectivity. • In database searching, as well as in many other areas in bioinformatics, are two • fundamental types of algorithms. • One is the exhaustive type, which uses a rigorous algorithm to find the best or exact solution for a particular problem by examining all mathematical combinations. • Dynamic programming is an example of the exhaustive method and is computationally very intensive. • Another is the heuristic type, which is a computational strategy to find an empirical or near optimal solution by using rules of thumb. • The shortcut strategy followed by this type is not guaranteed to find • the best or most accurate solution. • It is often used because of the need for obtaining results within a realistic time frame without significantly sacrificing the accuracy of the computational output.
HEURISTIC DATABASE SEARCHING Searching a large database using the dynamic programming methods, such as the Smith–Waterman algorithm, although accurate and reliable, is too slow and impractical when computationalresources are limited. Eg: querying a database of 300,000 sequences using a query sequence of 100 residues takes 2–3 hours to complete with a regular computer system at the time. Thus, speed of searching became an important issue. To speed up the comparison, heuristic methods have to be used. The heuristic algorithms perform faster searches because they examine only a fraction of the possible alignments examined in regular dynamic programming. Both BLAST and FASTA use a heuristic word method for fast pairwise sequence alignment. It works by finding short stretches of identical or nearly identical letters in two sequences. These short strings of characters are called words. The basic assumption is that two related sequences must have at least one word in common. Once regions of high sequence similarity are found, adjacent high-scoring regions can be joined into a full alignment.
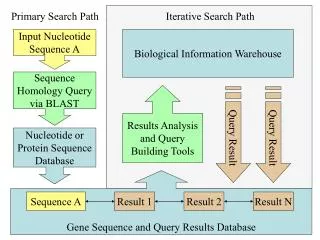
BASIC LOCAL ALIGNMENT SEARCH TOOL (BLAST) The BLAST program was developed by Stephen Altschul of NCBI in 1990. BLAST uses heuristics to align a query sequence with all sequences in a database.. The objective is to find high-scoring ungapped segments among related sequences. BLAST performs sequence alignment through the following steps. The first step is to create a list of words from the query sequence. Each word is typically three residues for protein sequences and eleven residues for DNA sequences. The list includes every possible word extracted from the query sequence. This step is also called seeding. The second step is to search a sequence database for the occurrence of these words. This step is to identify database sequences containing the matching words. The third step is matching of the words is scored by a given substitution matrix. A word is considered a match if it is above a threshold.
The fourth step involves pairwise alignment by extending from the words in both directions while counting the alignment score using the same substitution matrix. The extension continues until the score of the alignment drops below a threshold due to mismatches (the drop threshold is twenty-two for proteins and twenty for DNA). The resulting contiguous aligned segment pair without gaps is called high-scoring segment pair (HSP) In the original version of BLAST, the highest scored HSPs are presented as the final report. They are also called maximum scoring pairs. Improvement in the implementation of BLAST is the ability to provide gapped alignment. In gapped BLAST, the highest scored segment is chosen to be extended in both directions using dynamic programming where gaps may be introduced. The extension continues if the alignment score is above a certain threshold.
Variants BLAST is a family of programs that includes BLASTN, queries nucleotide sequences with a nucleotide sequence database. BLASTP, uses protein sequences as queries to search against a protein sequence database. BLASTX uses nucleotide sequences as queries and translates them in all six reading frames to produce translated protein sequences, which are used to query a protein sequence database. TBLASTN, queries protein sequences to a nucleotide sequence database with the sequences translated in all six reading frames. TBLASTX. uses nucleotide sequences, which are translated in all six frames, to search against a nucleotide sequence database that has all the sequences translated in six frames. In addition, there is also a bl2seq program that performs local alignment of two user-provided input sequences.
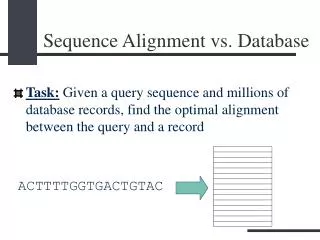
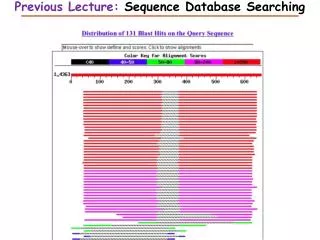
The BLASTweb server(www.ncbi.nlm.nih.gov/BLAST/) The graphical output includes horizontal bars and a diagonal in a two-dimensional diagram showing the overall extent of matching between the two sequences.. The BLAST output provides a list of pairwise sequence matches ranked by statistical significance. The significance scores help to distinguish evolutionarily related sequences from unrelated ones. Generally, only hits above a certain threshold are displayed. In BLAST searches, this statistical indicator is known as the E-value (expectation value), and it indicates the probability that the resulting alignments from a database search are caused by random chance. The E-value is related to the P-value used to assess significance of single pairwise alignment.
BLAST compares a query sequence against all database sequences, and so the E-value is determined by the following formula: E = m × n × P where m is the total number of residues in a database, n is the number of residues in the query sequence, and P is the probability that an HSP alignment is a result of random chance. Eg; 10−6. It is expressed as 1e– 6 in BLAST output. This indicates that the probability of this database sequence match occurring due to random chance is 10−6. TheE-value provides information about the likelihood that a given sequencematch is purely by chance. The lower the E-value, the less likely the database match is a result of random chance and therefore the more significant the match is.
A bit score is another prominent statistical indicator used in addition to the Evalue in a BLAST output. The bit score measures sequence similarity independent of query sequence length and database size and is normalized based on the raw pairwise alignment score. (S’) Thus, the higher the bit score, the more highly significant the match is.
BLAST Output Format TheBLASToutputincludes a graphical overview box, a matching list and a text descriptionof the alignment. The graphical overview box contains colored horizontalbars that allow quick identification of the number of database hits and the degrees of similarity of the hits. The color coding of the horizontal bars corresponds to the ranking of similarities of the sequence hits (red: most related; green and blue: moderately related; black: unrelated). The length of the bars represents the spans of sequence alignments relative to the query sequence. Each bar is hyperlinked to the actual pairwisealignment in the text portion of the report. The graphical box is a list of matching hits ranked by the E-values in ascending order. Each hit includes the accessionnumber, title (usually partial) of the database record, bit score, and E-value. This list is followed by the text description,which may be divided into threes ections: the header, statistics, and alignment.
The header section contains the gene index number or the reference number of the database hit plus a one-line description of the database sequence. This is followed by the summary of the statistics of the search output, which includes the bit score, E-value, percentages of identity, similarity (“Positives”), and gaps. In the actual alignment section, the query sequence is on the top of the pair and the database sequence is at the bottom of the pair labeled as Subject. In between the two sequences, matching identical residues are written out at their corresponding positions, where as nonidentical but similar residues are labeled with “+”. Any residues identified as LCRs*(lowcomplexityregions )in the query sequence are masked with Xs or Ns so that no alignment is represented in those regions. *(For both protein andDNA sequences, there may be regions that contain highly repetitive residues, such as short segments of repeats, or segments that are over represented by a small number of residues. )
FASTA FASTA (FAST ALL, www.ebi.ac.uk/fasta33/) preceding the development of BLAST ,FASTA was in fact the first database similarity search tool developed. FASTA uses a “hashing” strategy to find matches for a short stretch of identical residues with a length of k. The string of residues is known as ktuplesor ktups, which are equivalent to words in BLAST, but are normally shorter than the words. Typically, a ktup is composed of two residues for protein sequences and six residues for DNA sequences. The first step in FASTA alignment is to identify ktups between two sequences by using the hashing strategy. This strategy works by constructing a lookup table that shows the position of each ktup for the two sequences under consideration. The positional difference for each word between the two sequences is obtained by subtracting the position of the first sequence from that of the second sequence and is expressed as the offset.
The ktups that have the same offset values are then linked to reveal a contiguous identical sequence region that corresponds to a stretch of diagonal in a two-dimensional matrix. The second step is to narrow down the high similarity regions between the two sequences. The top ten regions with the highest density of diagonals are identified as high similarity regions. The diagonals in these regions are scored using a substitution matrix. Neighboring high-scoring segments along the same diagonal are selected and joined to form a single alignment. This step allows introducing gaps between the diagonals while applying gap penalties. The score of the gapped alignment is calculated again. In step 3, the gapped alignment is refined further using the Smith–Waterman algorithm to produce a final alignment The last step is to perform a statistical evaluation of the final alignment as in BLAST, which produces the E-value.
Similar to BLAST, FASTA has a number of subprograms. The web-based FASTAprogram offered by the European Bioinformatics Institute (www.ebi.ac.uk/) allows the use of either DNA or protein sequences as the query to search against a protein database or nucleotide database. Some available variants of the program are FASTX, which translates a DNAs equenceand uses the translated protein sequence to query a protein database, and TFASTX, which compares a protein query sequence to a translated DNA database.
Statistical Significance FASTA also uses E-values and bit scores. However, the FASTA output provides one more statistical parameter, the Z-score. This describes the number of standard deviations from the mean score for the database search. Because most of the alignments with the query sequence are with unrelated sequences,thehigher the Z-score for a reported match, the further away from the mean of the score distribution, hence, the more significant the match. Z-score > 15,extremely Significant. 5 to 15, highly probable homologs. Z < 5, their relationships is described as less certain.
SCORING MATRICES In the dynamic programming algorithm presented, the alignment procedure has to make use of a scoring system, which is a set of values for quantifying the likelihood of one residue being substituted by another in an alignment . The scoring systems is called a substitution matrix and is derived from statistical analysis of residue substitution data from sets of reliable alignments of highly related sequences. Scoring matrices for nucleotide sequences are relatively simple. A positive value or high score is given for a matchand a negative value or low score for a mismatch. Scoring matrices for amino acids are more complicated because scoring has to reflect the physicochemical properties of amino acid residues, as well as the likelihood of certain residues.
The hydrophobic residue group includes methionine, isoleucine, leucine, and valine. Small and polar residues include serine, threonine, and cysteine. Residues within these groups have high likelihoods of being substituted for each other. However, cysteine contains a sulfhydryl group that plays a role in metal binding, active site, and disulfide bond formation. Substitution of cysteine with other residues therefore often abolishes the enzymatic activity or destabilizes the protein structure.
AMINO ACID SCORING MATRICES • Amino acid substitution matrices, which are 20 × 20 matrices, have been devised to • reflect the likelihood of residue substitutions. • There are essentially two types of amino acid substitution matrices. • One type is based on interchangeability of the genetic code or amino acid properties, and • The other is derived from empirical studies of amino acid substitutions. • Although the two different approaches coincide to a certain extent, the first approach considered as less accurate than the second approach. • The empirical matrices, which include PAM and BLOSUMmatrices, are derived from actual alignments of highly similar sequences.
By analyzing the probabilities of amino acid substitutions in these alignments, a scoring system can be developed by giving a high score for a more likely substitution and a low score for a rare substitution. positive scorerepresent substitutions of very similar residues or identical residues. Zero score means relationship between the amino acids is weakly similar at best in terms of physicochemical properties. negative score means substitutions between dissimilar residues.
The substitution matrices apply logarithmic conversions to describe the probability of amino acid substitutions. The converted values are the so-called log-odds scores (or log-odds ratios), (which are logarithmic ratios of the observed mutation frequency divided by the probability of substitution expected by random chance) The conversion can be either to the base of 10 or to the base of 2.
For example, in an alignment that involves ten sequences, each having only one aligned position, nine of the sequences are F (phenylalanine) and the remaining one I (isoleucine). The observed frequency of I being substituted by F is one in ten (0.1) whereas the probability of I being substituted by F by random chance is one in twenty (0.05). Thus, the ratio of the two probabilities is 2 (0.1/0.05). After taking this ratio to the logarithm to the base of 2, this makes the log odds equal to 1 This value can then be interpreted as the likelihood of substitution between the two residues being 2 1. which is two times more frequently than by random chance. PAM BLOSUMMatrices &
PAM Matrices The PAM matrices (also called Dayhoff PAM matrices) were first constructed by Margaret Dayhoff, who compiled alignments of seventy-one groups of very closely related protein sequences. PAM stands for “point accepted mutation” (although “accepted point mutation” or APM may be a more appropriate term, PAM is easier to pronounce). Because of the use of very closely related homologs, the observed mutations were not expected to significantly change the common function of the proteins. Thus, the observed amino acid mutations are considered to be accepted by natural selection. The PAM matrices were subsequently derived based on the evolutionary divergence between sequences of the same cluster. One PAM unit is defined as 1% of the amino acid positions that have been changed.
To construct a PAM1 substitution table, a group of closely related sequences with mutation frequencies corresponding to one PAM unit is chosen. Based on the collected mutational data from this group of sequences, a substitution matrix can be derived. Construction of the PAM1 matrix involves alignment of full-length sequences and subsequent construction of phylogenetic trees using the parsimony principle. This allows computation of ancestral sequences for each internal node of the trees Ancestral sequence information is used to count the number of substitutions along each branch of a tree. The PAM score for a particular residue pair is derived from a multistep procedure involving calculations of relative mutability, normalization of the expected residue substitution frequencies by random chance, and logarithmic transformation to the base of 10of the normalized mutability value divided by the frequency of a particular residue.
The resulting value is rounded to the nearest integer and entered into the substitution matrix, which reflects the likelihood of amino acid substitutions. This completes the log-odds score computation. After compiling all substitution probabilities of possible amino acid mutations, a 20 × 20 PAM matrix is established. Positive scores in the matrix denote substitutions occurring more frequently than expected among evolutionarily conserved replacements. Negative scores correspond to substitutions that occur less frequently than expected. Other PAM matrices with increasing numbers for more divergent sequences are extrapolated from PAM1 through matrix multiplication. For example, PAM80 is produced by values of the PAM1 matrix multiplied by itself eighty times. A PAM unit is defined as 1% amino acid change or one mutation per 100 residues. The increasing PAMnumbers correlate with increasing PAMunits and thus evolutionary distances of protein sequences.
For example, PAM250, which corresponds to 20% amino acid identity, represents 250 mutations per 100 residues. In theory, the number of evolutionary changes approximately corresponds to an expected evolutionary span of 2,500 million years. Thus, the PAM250 matrix is normally used for divergent sequences. Accordingly, PAM matrices with lower serial numbers are more suitable for aligning more closely related sequences.
BLOSUMMatrices In the PAM matrix construction, the only direct observation of residue substitutions is in PAM1, based on a relatively small set of extremely closely related sequences. Sequence alignment statistics for more divergent sequences are not available. To fill in the gap, a new set of substitution matrices have been developed. This is the series of blocks amino acid substitution matrices (BLOSUM), all of which are derived based on direct observation for every possible amino acid substitution in multiple sequence alignments . These were constructed based on more than 2,000 conserved amino acid patterns representing 500 groups of protein sequences. The sequence patterns, also called blocks, are un gapped alignments of less than sixty amino acid residues in length. The frequencies of amino acid substitutions of the residues in these blocks are calculated to produce a numerical table, or block substitution matrix.
Instead of using the extrapolation function, the BLOSUM matrices are actual percentage identity values of sequences selected for construction of the matrices. For example,BLOSUM62indicatesthat the sequencess elected for constructing the matrix share an average identity value of 62%. In the reversing order as the PAM numbering system, the lower the BLOSUM number, the more divergent sequences they represent. The BLOSUM score for a particular residue pair is derived from the log ratio of observed residue substitution frequency versus the expected probability of a particular residue. The log odds is taken to the base of 2 instead of 10 as in the PAMmatrices. The resulting value is rounded to the nearest integer and entered into the substitution matrix. positive and negative values correspond to substitutions that occur more or less frequently than expected among evolutionarily conserved replacements.