Statistical Analysis for Data Sets: Control vs. 1g vs. 2g
Detailed statistical comparison of control, 1g, and 2g data sets showing significance levels and non-significant differences to aid in drawing conclusions. Learn to interpret and label different data sets effectively.

Statistical Analysis for Data Sets: Control vs. 1g vs. 2g
E N D
Presentation Transcript
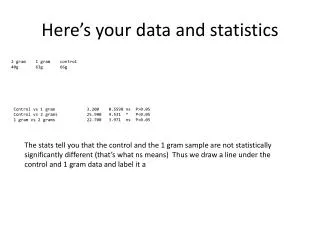
Here’s your data and statistics 2 gram 1 gram control 40g 63g 66g Control vs 1 gram 3.200 0.5598 ns P>0.05 Control vs 2 grams 25.900 4.531 * P<0.05 1 gram vs 2 grams 22.700 3.971 ns P>0.05 The stats tell you that the control and the 1 gram sample are not statistically significantly different (that’s what ns means) Thus we draw a line under the control and 1 gram data and label it a
Here’s your data and statistics 2 gram 1 gram control 40g 63g 66g Control vs 1 gram 3.200 0.5598 ns P>0.05 Control vs 2 grams 25.900 4.531 * P<0.05 1 gram vs 2 grams 22.700 3.971 ns P>0.05 a b The stats also tell you that the 1 gram and the 2 gram sample are not statistically significantly different (that’s what ns means) Thus we draw a line under the 1 gram and 2 gram data and label it b
Finally… You can make a table such as the one following and then label the means with their Letters to indicate which are statistically significantly different Means within a row not bearing the same letter are statistically Significantly different, p < 0,05