Discovery Map (ver 8/4/06)
500 likes | 947 Views
Discovery Map (ver 8/4/06). Dallas Independent School District. Ensure DISD Maximizes ROI on Oracle Technology and Applications. Develop DISD IT Architecture to Accommodate Short-term and Future Growth. Position DISD to be the IT Thought Leader in K-12.

Discovery Map (ver 8/4/06)
E N D
Presentation Transcript
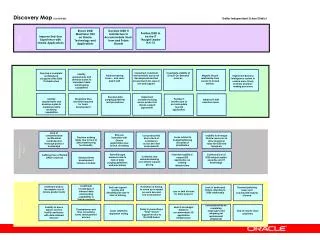
Discovery Map (ver 8/4/06) Dallas Independent School District Ensure DISD Maximizes ROI on Oracle Technology and Applications Develop DISD IT Architecture to Accommodate Short-term and Future Growth Position DISD to be the IT Thought Leader in K-12 Improve End-User Experience with Oracle Applications GOALS Implement consistent environments across all development and test environments for ease of use and support. Investigate viability of Oracle On-Demand services. Identify requirements and develop a plan to implement data warehousing capabilities Develop a complete architectural blueprint of the DISD IT infrastructure Address training issues – end-users and IT staff. Migrate Oracle relationship from vendor to trusted adviser. Implement Business Intelligence system to enable more timely business decision-making processes Key Business Requirements Develop data purging guidelines and procedures. Implement consistent pricing across products in Oracle support agreement. Identify requirements and develop a plan to implement data archiving capabilities Streamline time and effort required for forms development Position IT architecture to accommodate new SIS application. Address IT staff retention issues. Lack of comprehensive architectural roadmap and thorough product knowledge End user frustration with Oracle applications due to lack of training Lost productivity due to lack of consistency across dev/test environments Inability to leverage Oracle resources to drive maximum value for DISD and taxpayers Issues related to budget tightening and project prioritization Decision making delay due to lack of data warehousing functionality Consequential Pains Potential legal exposure due to lack of data purging guidelines and procedures Potential inability to support SIS application on existing infrastructure Continued loss of DISD subject matter expertise and IT knowledge Inefficient use of limited DASD resources Confusion and misunderstanding over Oracle support pricing Delayed forms development release schedule Insufficient knowledge of inherent data warehousing capabilities in Oracle products Inefficient and/or incomplete use of Oracle product suite Frustration of having to come up to speed on each dev and test environment End user support burden and dissatisfaction due to lack of training Lack of dedicated Oracle attention to DISD relationship Constant patching issues and cost/benefit analysis of same Loss or limit of funds for other projects Tactical Pains Lost productivity for remaining employees and retraining for replacement employees Inability to move data to archive facility and issues with data retained “forever” Search for budget dollars to accommodate SIS application infrastructure Delay in presenting a “final” Oracle support invoice to the DISD board Cumbersome and time consuming forms development process Issues related to regression testing End-of-month close problems
Discovery Map GOAL KBR Improve Customer Sat by 15% Expand Into New Markets Mike Pat KBR Free up $15M Working Capital CP Providing Poor Service Sue Mike CP Training Costs $200k Over Plan CP CP $1 million In External Consulting Fees Staffing $1 million Over Budget Concerns about Reputation CP Terry Sue Sue Terry CP Frustrated Users/Turnover CP Poor Productivity Terry Sue CP Not maximizing comp TP TP No easy user Reporting No 360 View Of Customers Ed Chris Sue TP TP TP TP TP No Web Reporting Disparate Systems No time/skills to install new system Manual Approvals Inadequate Security Ed Ed Ed Ed Ed
KPI/Workflow CRM/BI SAP - Siebel ? SAP Siebel - Discoverer “Stack”, Vertical& Horizontal Int. VPD SAP Siebel + IBM MSFT - IBM MSFT KBR GOAL Improve Customer Sat. 15% Expand In New Markets Solution Map Mike Pat KBR Free up $3M Working Capital CP Providing Poor Service Sue Mike CP Training Costs $200k over plan CP CP $1 Million in External Consulting Fees Staffing $1Million Over Budget Terry Sue Sue CP Frustrated Users/Turnover CP Poor Productivity Terry Sue TP TP No easy user reporting No 360 view of customers Chris Sue TP TP TP TP TP No Web Reporting Disparate Systems No time/skills to install new system Manual Approvals Inadequate Security OCS & OU Apps Workflow Ed Ed Ed Ed Ed SAP + Siebel = SAP + Siebel +
Financial Customer Process/Infrastructure Employee Increase Customer Satisfaction / Loyalty Improve Margins Improve Business Agility Improve Productivity while providing positive Work environment Goals Consolidate data for global view of data Flexible architecture enabling rapid response Improve employee satisfaction Better decision making to Support key business decisions Increase Revenue By X % Decrease cost By X % KBR Reduce risk and liability Improve process efficiencies 1 No easy access to accurate data in unified method 1 Poor Employee Satisfaction 1 Too many spreadsheets High maintenance and administration costs Unable to ensure data validity High IT employee turnover / stress Low employee Productivity Consequential Pains Poor Reporting And Analysis Inability to do profitability analysis No consolidated view of data Potential Fraud Inability to Close Books in Timely manner High maintenance and administration Costs Inconsistent identifiers for customers/suppliers/ products/etc. 1 Disparate Data Poor Performance Reliance on IT for reporting and analysis Tactical Pains Numerous reporting tools that are not integrated Multiple/Disparate OLTP systems Executive Insight Discovery Map
Financial Customer Process/Infrastructure Employee Increase Customer Satisfaction / Loyalty Improve Margins Improve Business Agility Improve Productivity while providing positive Work environment Goals Consolidate data for global view of data Flexible architecture enabling rapid response Improve employee satisfaction Better decision making to Support key business decisions Increase Revenue By X % Decrease cost By X % KBR Reduce risk and liability Improve process efficiencies 1 No easy access to accurate data in unified method 1 EIS Dashboard (Portal) Poor Employee Satisfaction EIS Platform (9i RDMS, OWB, 9iAS) 1 EIS Platform (9i RDMS, OWB, 9iAS) Too many spreadsheets High maintenance and administration costs Unable to ensure data validity EIS Access Tools (Discoverer, Reports, OLAP) High IT employee turnover / stress EIS Access Tools (Discoverer, Reports, OLAP) Low employee Productivity Consequential Pains Poor Reporting And Analysis Inability to do profitability analysis EIS Access Tools (Discoverer, Reports, OLAP) No consolidated view of data EIS Platform (9i RDMS, OWB, 9iAS) EIS Access Tools/ EIS Platform (Data Mining) Potential Fraud Inability to Close Books in Timely manner High maintenance and administration Costs EIS Platform (9i RDMS, OWB, 9iAS) Inconsistent identifiers for customers/suppliers/ products/etc. 1 EIS Platform (9i RDMS, OWB, 9iAS) EIS Platform (9i RDMS, OWB, 9iAS) Disparate Data EIS Platform (9i RDMS, OWB, 9iAS) Poor Performance EIS Access Tools (Discoverer, Reports, OLAP) Reliance on IT for reporting and analysis Tactical Pains EIS Access Tools (Discoverer, Reports, OLAP) Numerous reporting tools that are not integrated Oracle eBusiness Suite Multiple/Disparate OLTP systems Executive Insight Solution Map
Data Warehouse “A warehouse is a subject-oriented, integrated, time-variant and non-volatilecollection of data in support of management's decision making process” Bill Inmon, circa 1723
Data Warehousing • Benefits • Meet compliance and regulatory requirements through a single trusted source of truth • Reduce data integration costs between systems • Manage alignment between operational systems and IT through agile reporting & analysis platform • Provide an enabling platform for a company to compete on analytics • Reduce costs and complexity of best-of-breed BI&W
Business Intelligence “Business Intelligence is the process of transforming data into information and through discovery transforming that information intoknowledge” Gartner Group, circa 1993
Data Mining “Simply put, data mining is used todiscover patternsand relationshipsin your data in order to help you makebetter business decisions” Robert Small, Two Crows
Business Intelligence • Benefits • Meet compliance and regulatory requirements through appropriate access to information • Simple and timely access to data to support informed decision making and assessment (i.e. Management by fact) • Predict future behaviour as well as monitor past performance • Provide tools to manage, monitor and control the business • Reduce costs • Increase revenues • Create and manage customers
Customer InsightEnabled through effective BI&W solution • Benefits • Customer Insight can answer questions like • Who are your best customers? • What can you do to retain them? • How can you attract others like them? • How can you improve the profitability of your customers? • How can I reduce costs? • What would be the impact of new services? • What are future trends? • Meet regulatory and compliance regulations
Corporate Performance Management “all of the processes, methodologies, metrics and systems needed to measure and manage the performance of an organization” Gartner, circa 2001
KBR Performance Management Planning an aligned strategy KBR C-level C-level Aggr./ Disaggr. of data Allocating modelling & responsibilities Corporate Performance ManagementDiscovery Map CP CP Collecting historical data Multiple models for planning Org. structure aligned to model CP Fin Controller Fin Controller Fin Controller CP CP CP CP Consolidation of data Spreadsheet tools restrictive Fin Controller Fin Controller Fin Controller Fin Controller TP TP TP TP TP Quality of data Multiple data sources Time to collect data Time to model Amount of data Identify budgets Accuracy of data TP End User End User IT IT End User End User End User
Corporate Performance Management • Benefits • Meet legal and regulatory requirements • Improve understanding of the business • Link strategy, planning and reporting systems across the enterprise • Ensure that strategy, planning and reporting systems are consistent, repeatable and auditable • Establish clear lines of accountability for all aspects of the business • Manage by fact instead of soft information. • Remove Barriers throughout the Enterprise • Enable cross-functional sharing of information • Enhance communication among strategy formulation, planning and monitoring systems