Download
1 / 14
140 likes | 253 Views
This document discusses the measurement of forward-backward asymmetry (AFB) in lepton and quark production, along with the polarization of particles in collision experiments. The analysis includes lepton charge and direction measurements, the influence of initial and final state radiation, and the complexities inherent in quark AFB due to B0 oscillation and cascade decays. Key results from the LEP collaborations and potential implications for the Standard Model are presented, as well as insights into the measurement of polarized beams and tau polarization.

E N D
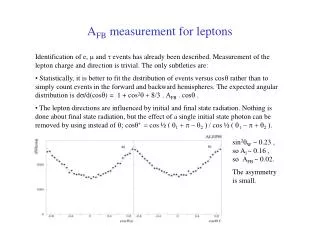
AFB measurement for leptons • Identification of e, m and t events has already been described. Measurement of the lepton charge and direction is trivial. The only subtleties are: • Statistically, it is better to fit the distribution of events versus cosq rather than to simply count events in the forward and backward hemispheres. The expected angular distribution is ds/d(cosq) = 1 + cos2q + 8/3 . AFB . cosq . • The lepton directions are influenced by initial and final state radiation. Nothing is done about final state radiation, but the effect of a single initial state photon can be removed by using instead of q; cosq* = cos ½ ( q1 + p - q2 ) / cos ½ ( q1 - p + q2 ). sin2qW ~ 0.23 , so Al ~ 0.16 , so AFB ~ 0.02. The asymmetry is small.
AFBl off peak and for electrons. The formulas that I gave for Al were for fermions produced in Z decay only (a). For all fermions there is a small correction due to photon exchange (b), which gets more significant away from the Z peak. For electrons there is also photon exchange in the “t channel” (c) which is strongly forward peaked. This is such a large correction that it is not reliable more than 1 GeV off peak (open circles). (a) (b) (c) 1993 Aleph data Final LEP combined values, corrected to the Z peak: AFBe = 0.0145±0.0025, AFBm = 0.0169±0.0013, AFBt = 0.0188 ± 0.0017.
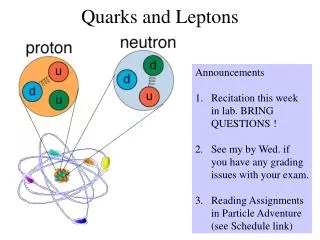
AFB measurement for quarks. More difficult but potentially more informative than lepton AFB. The expected asymmetry values are larger for quarks: plugging sin2qW ~ 0.23 into the formulas that I gave in the previous lecture yield the expectation that AFBb ~ 0.12 and AFBc ~ 0.08 . There are some difficulties: • B0 - B0 oscillation. Some of the b quarks will be in B0 hadrons and these can oscillate into B0 hadrons before they decay, changing the charge of the b quark. • Cascade decays. If a b event is correctly identified as such but the lepton actually came from b c l then the lepton will have the wrong sign. Also if c is misidentified as b or vice versa.
AFB results for quarks This shows the angular distribution of jets tagged as coming from c quarks Below are the AFB values measured for b and c quarks versus beam energy. The result of averaging together all four LEP experiments is AFBb = 0.0997 ± 0.0016 AFBc = 0.0706 ± 0.0035
ALR measurement. ALR is the difference of the Z production cross sections for left and right polarised electrons colliding with unpolarised positrons, divided by the sum. All you need is a polarised beam – need not be 100% , provided the polarisation is known. Simply count Z events, lumping all decay modes together. Potentially very low systematic errors. LEP never managed to produce longitudinally polarised beams. ( Transverse polarisation was achieved for short times. Measurement of resonant depolarisation frequency was important for calibrating the absolute energy scale of LEP1 hence the accurate vale of MZ. ). At SLAC linear collider where beams are used once then thrown away a high polarisation of the electron beam was achieved.
Polarised beams. Polarised electrons were produced by photo-emission from a strained GaAs cathode with a circularly polarised laser. Most of the electron polarisation survived the process of acceleration, bending and focussing up to the collision point in the SLD. Polarisation value (typically 75%) was measured with Compton scattering from circular polarised light, shown The results were ALR = 0.1514 ± 0.0022 , ALRFBe = 0.1544 ± 0.0060 , ALRFBm = 0.142 ± 0.015 , ALRFBt = 0.136 ± 0.015 .
Tau polarisation Easily understood in the case of t pn decay. The spin has to be carried by the neutrino and only one neutrino helicity is produced: neutrino direction anti-correlated with tau spin. When boosted to lab frame this appears as a linear slope in the pion energy distribution. Other cases are more difficult because of a spin 1 hadron in t rn and t a1n , or because of two neutrinos in t mnn andt enn . But they still give polarisation information from the energy spectra.
Tau polarisation results The fits to the energy spectra for the electron(a), muon(b), pion(c) and rho(d) channels. The tau polarisation averaged over four LEP experiments is Pt = 0.1439 ± 0.0043 and from the way that Pt varies with q they measure Ae = 0.1498 ± 0.0049
Global fit to the Standard Model • In order to test the Standard Model as completely as possible, some measurements which I have not discussed are included in the global fit: • The mass of the W boson, measured at the Fermilab proton-antiproton collider and at LEP2. • The mass of the top quark, measured at the Fermilab proton-antiproton collider. • A value of sin²qW , measured by deep inelastic scattering of neutrinos from nuclei (NuTeV experiment). • A measure of parity violation in atomic Caesium.
Fit results table Category Name Measured Uncertainty Fit Pull value value |M-F|/U Z line shape mZ 91.1875 ± 0.0021 91.1875 0.0GZ 2.4952 ± 0.0023 2.4966 0.6shad 41.540 ± 0.037 41.481 1.7 Rl 20.767 ± 0.025 20.739 1.0 AFBl 0.01714 ± 0.00095 0.0165 0.8 Tau polarisation Pt 0.1465 ± 0.0032 0.1483 0.6 Heavy flavour Rb 0.21630 ± 0.00066 0.2156 1.0 Rc 0.1723 ± 0.0031 0.1723 0.0 AFBb 0.0998 ± 0.0017 0.1040 2.4 AFBc 0.0706 ± 0.0035 0.0744 1.1 Ab 0.923 ± 0.020 0.935 0.6 Ac 0.670 ± 0.026 0.668 0.1 A Left-Right SLD ALR 0.1513 ± 0.0021 0.1483 1.4 W properties mw 80.425 ± 0.034 80.385 0.9 Gw 2.133 ± 0.069 2.093 0.6 Top quark mt 178.0 ± 4.3 178.1 0.0 NuTeV nN scattering sin²qw 0.2277 ± 0.0016 0.2229 3.0 Atomic P violation Qw(Cs) -72.84 ± 0.46 -72.90 0.1 A lot of independent measurements with accuracies in the range 0.1 % to 2% have been compared with the Standard Model and found to agree within three standard deviations.
Discussion of fit The Standard Model is in good shape. Thousands of physicist-years of effort has not yet uncovered a significant difference between experiment and the SM prediction.But don't despond - the previous sentence will probably not be true in 10 years time. The fit is not perfect. The c² per degree of freedom* is 25.4/15. The probability of a c² value equal or larger than this occurring by chance is 4.5%. So it is plausible that the Standard Model is precisely accurate and this is just a statistical fluctuation. Even so, look at the origin of the high c². Nine units of c² are due to the NuTeV result. Excluding it gives c²/d.o.f. = 16.7/14, probability 27% . Another 5.8 units of c² are due to the forward-backward asymmetry of Zbb events. This arises because there are a number of measurements which fix Al rather accurately, which in turn fixes sin²qW , which in turn fixes AFBb to 0.1036. Whereas the LEP and SLD experiments get consistent results and their average is AFBb = 0.0997±0.0016. There is no expected type of new physics which would influence AFBb in this way. Neither result is excessively improbable so we ignore the high values of c² and proceed... The parameters which were allowed to vary, and their best fit values, are: mt = 178.1 ± 4.3 GeV, mH = 114 +69 –45 GeV, as(mZ) = 0.1186 ± 0.0027 (*) c² = S ((Measurement-Fit)/Uncertainty)² ) . For a fit with a large number of degrees of freedom the c²/d.o.f. is around 1.
Higgs mass According to the fit to all precision data the most likely value of the Higgs mass is slightly below the limit set by direct searches at LEP2. There is debate about how to treat this situation statistically. But in this case it does not matter much – the upper limit on the Higgs mass is around 220 GeV at 95% confidence level.
Top mass After the Higgs, the least well known particle in the Standard Model is the top quark. This plot shows how the precision data constrain both masses. A fit which uses all other data (dashed line) is consistent with the direct measurement of mt (green band). The dominant part of the electroweak radiative corrections is proportional to mt2 and to –log(mH) which accounts for the diagonal shape of the error ellipse.
Expect over the next 5 years: • D0 and CDF at the Tevatron will reduce uncertainty on mWby factor 2 and on mt by factor 3. This will reduce the uncertainty on mHin the global fit by a factor 2. So we will know fairly well where to look for the Standard Model Higgs, but it is unlikely that the Tevatron will collect enough luminosity to find the Higgs itself. • Higher order theoretical calculations and new experimental measurements of s(e+e- hadrons) at low energy will either agree with the experimental value of muon g-2 , or disagree and hint at super-symmetry or ... • Soon after the LHC switches on in 2007 it should either • Find the SM Higgs Interesting • prove it is not in the mass range predicted Even more interesting • and it might find SUSY or something totally unexpected. The Future