Download
1 / 8
90 likes | 221 Views
This free-standing mathematics activity explores how to model the speed of a car and the distance it travels using graphs. Students will analyze a car traveling at 70 mph to determine its distance in 2 hours and investigate acceleration scenarios, like going from 0 to 72 kph. They will calculate areas under curves using triangles and trapeziums, estimating distances traveled based on various speeds and times. The activity encourages critical thinking about the accuracy of estimates and the connection between graph shapes and real-world vehicle speeds.

E N D
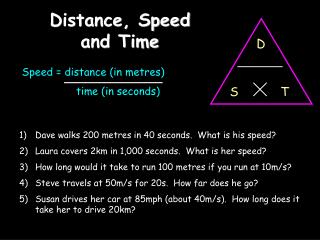
Free-Standing Mathematics Activity Speed and distance
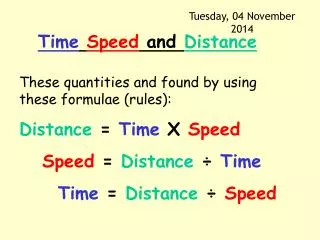
How can we model the speed of a car? • How will the model show the distance the car travels?
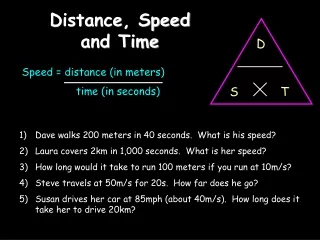
vmph 70 0 2 thours Using a graph Think about How far will it travel in 2 hours? Car travelling at 70 mph Area = 2 × 70 = 140 This is the distance travelled, 140 miles
20 ms-1 vkph Car accelerating steadily from 0 to 72 kph in 10 seconds =20 metres per second 72 0 tseconds 10 72 kph = Area of triangle = 100 Distance travelled = 100 metres Think about What was the car’s average speed? What is the connection with the graph?
30 vms-1 18 b a 5 0 tseconds Area = Car accelerating steadily from 18 ms-1 to 30 ms-1 in 5 seconds Area of a trapezium h = 24 × 5 = 120 Distance travelled = 120 metres Think about What was the car’s average speed? What is the connection with the graph?
Car travelling between 2 sets of traffic lights t(s) 0 2 4 6 8 10 12 v(ms-1) 0 5 8 9 8 5 0 v ms-1 9 8 5 C C B B A A 2 4 6 8 10 12 t seconds Think about Why are the strips labelled A, B & C? How will this help to find the area? Area of A = 5 Area of B = 13 Area of C = 17 0 Think about Is this a good estimate? How can it be improved?Is the graph realistic? Total area = 70 Distance travelled = 70 metres
Car travelling with speed v = 0.5t3 – 3t2 + 16 t(s) 0 1 2 3 4 v(ms-1) v 16 13.5 8 2.5 t 0 4 2 3 1 2.5 0 16 13.5 8 Think about What did this car do? Area = = 14.75 + 10.75+ 5.25 + 1.25 Think about How could this estimate be improved? Distance travelled = 32 metres
At the end of the activity • Explain why using triangles and trapezia can only give an estimate of the area under a curve • When is an estimate smaller than the actual value? When is it larger? • How can you improve the estimate? • How well do you think the graphs and functions you have studied model the actual speed of real cars? • In what way would graphs showing actual speeds differ from those used in this activity?