Download
1 / 34
340 likes | 489 Views
Distribution of Mutation Effects and Adaptation in an RNA Virus. Christina Burch UNC Chapel Hill. We know a lot about selection. Ronald Fisher. R = h 2 S. J. W. Dudley, R. J. Lambert, Plant Breed . Rev . 24 (part 1), 79 (2004). Original population range.

E N D
Distribution of Mutation Effects and Adaptation in an RNA Virus Christina Burch UNC Chapel Hill
We know a lot about selection Ronald Fisher R = h2S J. W. Dudley, R. J. Lambert, Plant Breed. Rev. 24 (part 1), 79 (2004).
Original population range We know less about the resulting adaptations. Ronald Fisher J. W. Dudley, R. J. Lambert, Plant Breed. Rev. 24 (part 1), 79 (2004).
The Goal: Measure the distribution of spontaneous mutation effects. Probability density -0.4 -0.3 -0.2 -0.1 0 0.1 mutation effect (s)
The Data We conduct laboratory evolution experiments using microbes so that we can monitor evolution in real time.
Growing bacteriophage in the lab bacteriophage + bacteria
Small population Large population
Fitness Loss 0.25 0 -0.25 -0.5 Log(fitness) -0.75 -1 -1.25 -1.5 0 10 20 30 40 50 Generation
Fitness Loss 0.25 Genome sequencing reveals that one mutation was acquired right here 0 -0.25 -0.5 Log(fitness) -0.75 -1 -1.25 -1.5 0 10 20 30 40 50 Generation
0.25 0 -0.25 -0.5 -0.75 -1 -1.25 -1.5 0 10 20 30 40 50 Fitness Loss Statistics can give the same answer, and statistics are much cheaper! Log(fitness) Generation
Adaptation 0.25 0 -0.25 Log(fitness) -0.5 -0.75 -1 -1.25 -1.5 0 25 50 75 100 Generation
Adaptation Genome sequencing of the endpoint reveals TWO new mutations. 0.25 0 -0.25 Log(fitness) -0.5 -0.75 -1 -1.25 -1.5 0 25 50 75 100 Generation
0.25 0 -0.25 -0.5 -0.75 -1 -1.25 -1.5 0 25 50 75 100 Adaptation Again, statistics can give the same answer. Log(fitness) Generation
The Goal: Measure the distribution of spontaneous mutation effects. Probability density -0.4 -0.3 -0.2 -0.1 0 0.1 mutation effect (s)
A slightly simpler goal: Measure the distribution of spontaneous mutation effects in a well adapted genome. Probability density -0.4 -0.3 -0.2 -0.1 0 0.1 mutation effect (s)
The Goal: Measure the distribution of spontaneous mutation effects in a well adapted genome. …40 days… …40 days… …40 days… . . . 10 lineages Burch, C. L. et al. (2007) Genetics 176:467-476.
Genome sequence at the start and end of the experiment tells us how many mutations accumulated.
We also measure fitness every day. plaque area transfer
Fitness measures, alone, allow identification of many mutations.
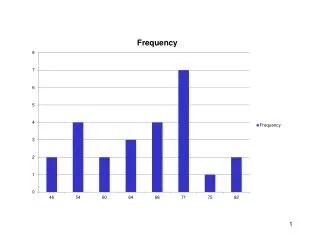
Effects of observed mutations 10 Number of mutations 5 0 0 0.1 0.2 0.3 0.4 0.5 mutation effect (s)
Estimating distribution shapes by Maximum Likelihood Observed Sample 10 Number of mutations 5 0 0 0.1 0.2 0.3 0.4 0.5 Unknown Population of Spontaneous Mutations Probability density 0 0.1 0.2 0.3 0.4 0.5 mutation effect (s)
Excellent correspondence between the likelihood analysis and the molecular data Genome sequencing: 56 total mutations. 32 non-synonymous mutations. Maximum Likelihood Estimates # deleterious mutations = 34 Average effect (s) = 0.142 10 probability density 5 0 0 0.1 0.2 0.3 0.4 0.5 s Burch, C. L. et al. (2007) Genetics 176:467-476.
Acknowledgements • Phyllis Driscoll UNC Biology • Sebastien Guyader • Mihee Lee UNC Statistics • Dan Samarov • Haipeng Shen National Institutes of Health