Download
1 / 6
60 likes | 139 Views
This study examines the 2015 Texas flooding using NASA resources to analyze its full impact on land and sea areas. Results show the importance of integrated land/sea analysis for future flood assessments.

E N D
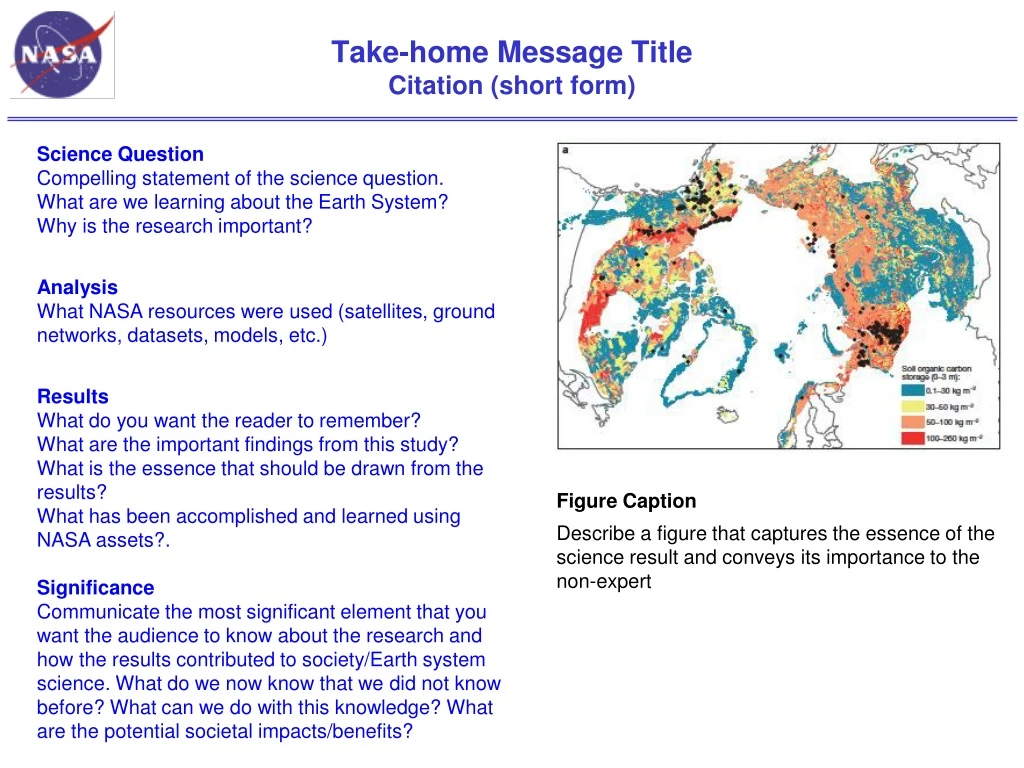
Take-home Message TitleCitation (short form) Science Question Compelling statement of the science question. What are we learning about the Earth System? Why is the research important? Analysis What NASA resources were used (satellites, ground networks, datasets, models, etc.) Results What do you want the reader to remember? What are the important findings from this study? What is the essence that should be drawn from the results? What has been accomplished and learned using NASA assets?. Significance Communicate the most significant element that you want the audience to know about the research and how the results contributed to society/Earth system science. What do we now know that we did not know before? What can we do with this knowledge? What are the potential societal impacts/benefits? Figure Caption Describe a figure that captures the essence of the science result and conveys its importance to the non-expert
Notes Citation: Full, formal citation, Ex. Schuur, E. A. G., A. D. McGuire, C. Schädel, G. Grosse, J. W. Harden, D. J. Hayes, G. Hugelius et al. "Climate change and the permafrost carbon feedback." Nature 520, no. 7546 (2015): 171-179. Award Information: Title of the solicitation (including ROSES call number) NASA Award/contract number Ex. This research was supported by the NASA Terrestrial Ecology Program (NNH16ZDA001N-Task A4.) under NASA Award number XXXXX This research supported the NASA Terrestrial Ecology Arctic-Boreal Vulnerability Experiment
SMAP Observes Flooding from Land to Sea: The Texas Event of 2015 S. Fournier, J.T. Reager, T. Lee, J. Vazquez-Cuervo, C.H. David, & M.M. Gierach (Oct 2016). GRL Vol 43: 19. DOI: 10.1002/2016GL070821 Background: • Floods can have damaging impacts on both land and sea, yet studies of flooding events tend to focus on only one side of the land/sea continuum. Analysis: • Analysis of a 2015 Texas flood is the first to document the full life cycle and impacts of a flood on both land and ocean. • The research team used measurements from SMAP with observations from TRMM, GPM, GRACE, MODIS (flown on Terra and Aqua), and the Jason series of satellites to create a comprehensive timeline and map of the flood and its regional effects. Monthly maps of (a) May and (b) August 2015 SMAP soil moisture inland and sea surface salinity (SSS). The black line delimits the Texas Gulf Coast Hydrologic Region. The colored dots correspond to the gauge for each major Texas river. The colored squares delimit five different boxes used to compute the averaged SSS. Findings: • Reported comprehensive chronology of the flooding: • above average rainfall preceding the flood caused soils to saturate; • record rainfall then generated record river discharge; and • subsequently, an unusual freshwater plume associated with anomalous ocean currents formed in the north central Gulf of Mexico. • Significance: • Integrated land/sea analysis of flood evolution can improve impact assessments of future extreme flooding events.
Effects Of Sea Ice Cover On Primary Production In The Arctic Ocean Kahru, M., et al. (2016), Biology Letters, 12: 20160223, http://dx.doi.org/10.1098/rsbl.2016.0223. • Background • Decrease in the summer extent of Arctic sea ice has been correlated with an increase in net primary production (NPP), but the magnitude of increase has been debatable due to large errors in satellite estimates. • Analysis • Novel algorithm and merged satellite data (OCTS, SeaWiFS, MERIS, MODIS) from multiple satellites was applied for 1997-2015. • Findings • Primary productivity in the Arctic Ocean has increased by 47% from the first half (1998-2006) to the 2nd half of the series (2007-2015); changes after 2011 have been minor. • Increased open water area has the strongest effect on increasing NPP in June. • In the northern Barents Sea, sea ice retreat has begun earlier (-4.5 days/year), and so has the high-productivity season (-3.0 days/year). Freeze-up is occurring later, but the timing of the end of the high NPP period has not changed. Missing ocean colour data (white) during the winter season (January, 2015), ice cover (pink to purple) in the north and the detected chlorophyll-a (blue to yellow) in the south. Monthly time series of NPP between latitudes 66˚ N and 84˚ N. • Significance • Increased NPP makes more food available for Arctic food webs including benefits for commercial fisheries, but changes in timing may reduce its positive effect.
Mean annual water availability 1985-2014 P-ET0; cm/yr Background: Forests in the western US range from dry woodlands to high biomass coastal rainforest. Water availability is projected to decline over the coming century, with rising temperatures increasing evapotranspiration. Forest response remains uncertain. Methods: Evaluated forest response to long-term changes in water availability by quantifying changes in tree productivity and biomass. Quantified water availability as difference between input (precipitation, P) and demand (reference evapotranspiration, ET0) over water year (Oct-Sep). Quantified forest characteristics using inventories from ~2,000 sites (WA, OR, CA) and remote sensing spanning ~18 Mha of mature forests across the western US. Results: • Annual water availability varied widely across the region, with most areas too dry to support forests. • Tree productivity and biomass increased with annual water availability across mature forests in the region. • Bioclimatic relationships broadly similar with forest inventories or remote sensing; however, remote sensing estimates saturated in high-productivity, high-biomass forests. Significance: Annual water availability is a key constraint on forest distribution, productivity and biomass in the region, highlighting sensitivity to projected declines in water availability. Remotely sensed forest characteristics enable tracking of forest response to climate, yet saturation issues hinder monitoring high-biomass forests. Water Availability Constrains Tree Productivity and Biomassin Mature Forests across the Western United States Berner, Law, and Hudiburg 2017. Biogeosciences Forest inventories (WA, OR, and CA) Remote sensing (Western US) Tree biomass (Mg C ha-1) Tree productivity (Mg C ha-1 yr-1) Annual water availability (P-ET0; cm/yr)
Forest Canopy Signals Reveal Belowground Fungal Associations Fisher, J.B., Sweeney, S. et al, 2016. Tree–mycorrhizal associations detected remotely from canopy spectral properties. Global Change Biology 22(7): 2596-2607. Problem: Nearly all tree species form symbiotic relationships with only one of two types of mycorrhizal fungi—AM or ECM. The type of fungi determines the ability of trees to access nutrients and subsequently take up CO2; but, we do not know where these fungi are or how they are distributed. Analysis: Explored remotely sensed tree canopy spectral properties to detect underlying mycorrhizal association across a gradient of AM- and ECM-dominated forest plots. Statistical mining of reflectance and reflectance derivatives across moderate/high-resolution Landsat data revealed distinctly unique phenological signals that differentiated AM and ECM associations. Approach was trained and validated against measurements of tree species and mycorrhizal association across ~130 000 trees throughout the temperate U.S/ Result: While all tree species have unique spectral signatures, we found that species associating with one fungal type had spectral properties more similar to each other than those associating with the other fungal type. We tested this successfully at ~130,000 trees throughout the US, and created regional maps of mycorrhizal association. Mycorrhizal fungi associating with plant roots Percent AM 0 - 5 ECM Image from: Alberton & Kuyper (2009) 5 - 10 10 -15 15 - 20 20 - 25 25 - 30 30 - 35 35 - 40 40 - 45 45 - 50 50 - 55 55 - 60 60 - 65 65 - 70 70 - 75 75 - 80 80 - 85 85 - 90 90 - 95 95 - 100 AM Non-Forest Clouds Above: Landsat scene coverage of mycorrhizalcomposition in 1 of 4 study sites, the Smithsonian Conservation Biology Institute area in Virginia. Significance: This capability to map mycorrhizal association is critical to our ability to understand how the terrestrial biosphere will respond to a changing CO2 environment and climate.